Technical Analysis of STRA 2024-05-10
Overview:
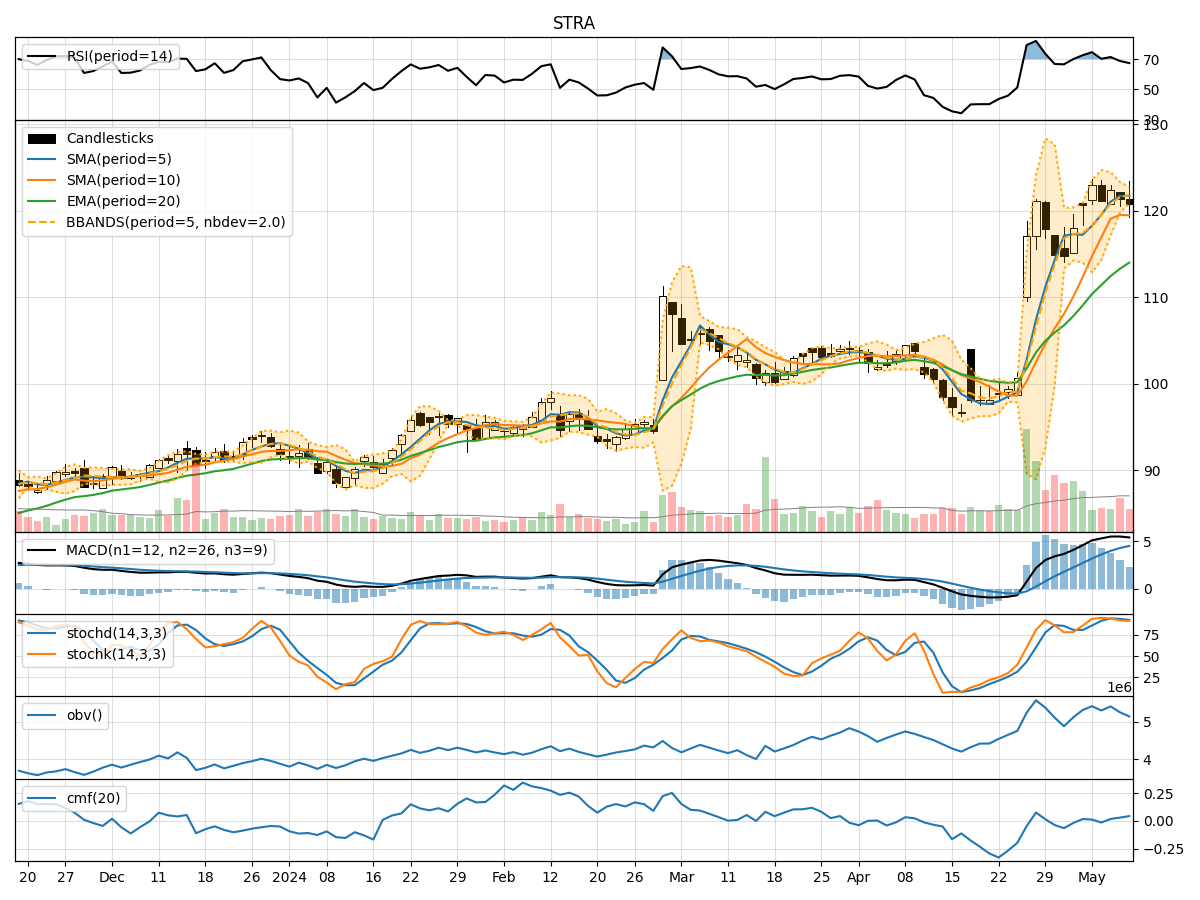
In analyzing the technical indicators for STRA over the last 5 days, we will delve into the trend, momentum, volatility, and volume indicators to provide a comprehensive outlook on the possible stock price movement in the coming days.
Trend Analysis:
- Moving Averages (MA): The 5-day Moving Average (MA) has been consistently above the longer-term Simple Moving Average (SMA) and Exponential Moving Average (EMA), indicating a bullish trend.
- MACD: The MACD line has been above the signal line, with both lines showing an upward trend, suggesting bullish momentum.
Momentum Analysis:
- RSI: The Relative Strength Index (RSI) has been fluctuating but generally staying above 50, indicating a neutral to slightly bullish momentum.
- Stochastic Oscillator: Both %K and %D have been in the overbought zone, suggesting a potential reversal or consolidation.
Volatility Analysis:
- Bollinger Bands (BB): The stock price has been trading within the bands, with the %B indicator showing a slight decline, indicating a possible decrease in volatility.
Volume Analysis:
- On-Balance Volume (OBV): The OBV has been fluctuating but generally showing an uptrend, indicating accumulation by investors.
- Chaikin Money Flow (CMF): The CMF has been positive, suggesting buying pressure in the stock.
Key Observations:
- The trend indicators suggest a strong bullish sentiment in the short term.
- Momentum indicators show a mixed signal with a potential for a reversal in the overbought zone.
- Volatility has been relatively stable, indicating a possible consolidation phase.
- Volume indicators point towards accumulation and buying pressure.
Conclusion:
Based on the analysis of the technical indicators, the next few days for STRA could see further upward movement in the stock price. However, caution is advised as the momentum indicators signal a potential reversal in the overbought zone. The stock may enter a consolidation phase before resuming its upward trend. Investors should closely monitor the price action and key support/resistance levels for better entry or exit points.