Technical Analysis of STTK 2024-05-10
Overview:
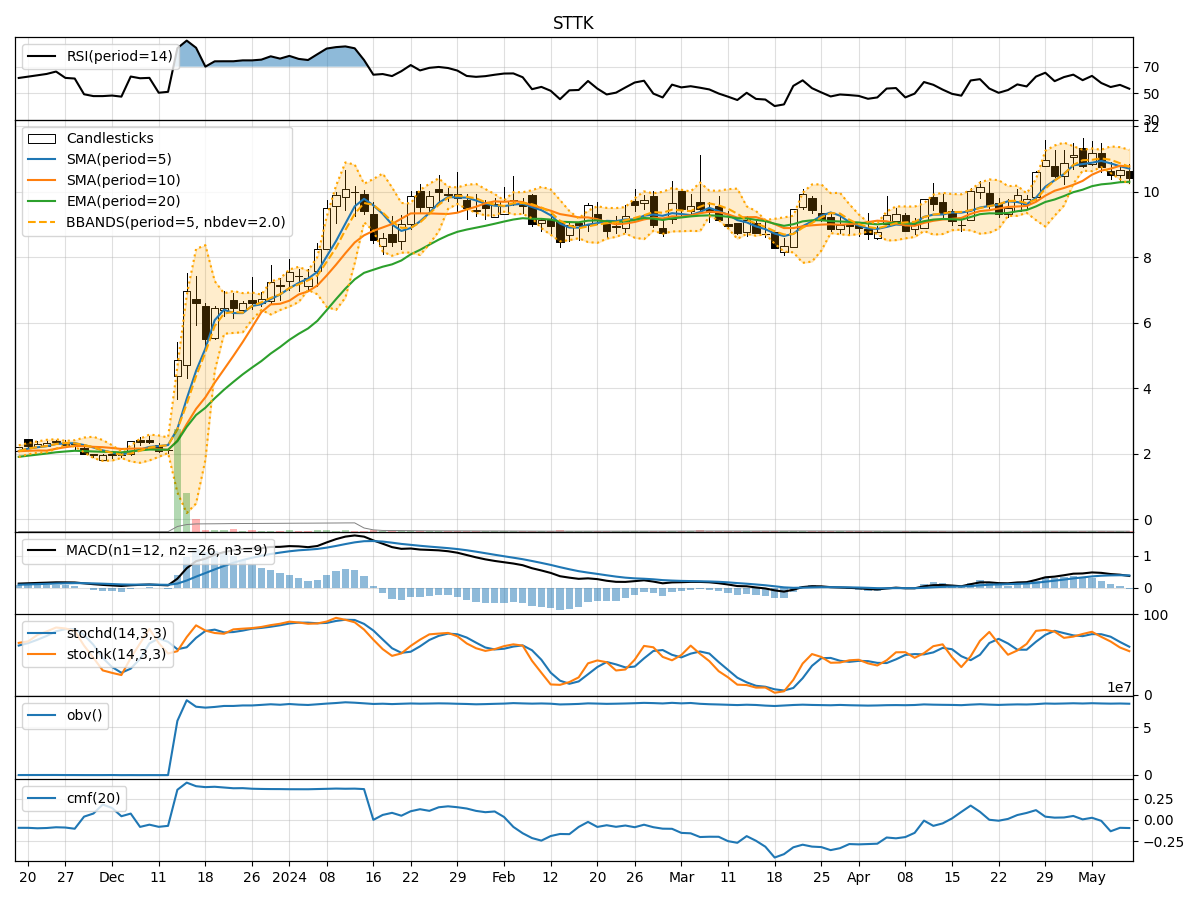
In analyzing the technical indicators for STTK over the last 5 days, we will delve into the trend, momentum, volatility, and volume indicators to provide a comprehensive outlook on the possible stock price movement. By examining these key factors, we aim to offer valuable insights and predictions for the upcoming days.
Trend Analysis:
- Moving Averages (MA): The 5-day Moving Average (MA) has been fluctuating around the current price, indicating a neutral trend.
- MACD: The MACD line has been hovering around the signal line, suggesting a lack of clear direction in the short term.
- RSI: The Relative Strength Index (RSI) has been oscillating around the 50 level, reflecting a balanced momentum.
Momentum Analysis:
- Stochastic Oscillator: The Stochastic Oscillator has been in the oversold territory, indicating a potential reversal in the near future.
- Williams %R: The Williams %R is showing oversold conditions, suggesting a possible bounce back.
Volatility Analysis:
- Bollinger Bands: The Bollinger Bands have been narrowing, indicating decreasing volatility and a potential breakout soon.
Volume Analysis:
- On-Balance Volume (OBV): The OBV has been fluctuating, suggesting indecision among investors.
- Chaikin Money Flow (CMF): The CMF has been negative, indicating selling pressure in the market.
Key Observations:
- The stock is currently in a consolidation phase with mixed signals from various indicators.
- The lack of a clear trend in moving averages and MACD suggests uncertainty in the short term.
- Momentum indicators like Stochastic and Williams %R point towards a possible reversal or bounce back.
- Volatility is decreasing, indicating a potential breakout or significant price movement ahead.
- Volume indicators show indecision among investors, with selling pressure reflected in CMF.
Conclusion:
Based on the analysis of technical indicators, the next few days' possible stock price movement for STTK is likely to be sideways with a potential for a bullish reversal. Traders should closely monitor the Stochastic and Williams %R for signs of a bounce back, while also keeping an eye on volatility for a potential breakout. The overall sentiment is cautiously optimistic, but it is essential to wait for confirmation from key indicators before making any trading decisions.