Technical Analysis of SUUN 2024-05-10
Overview:
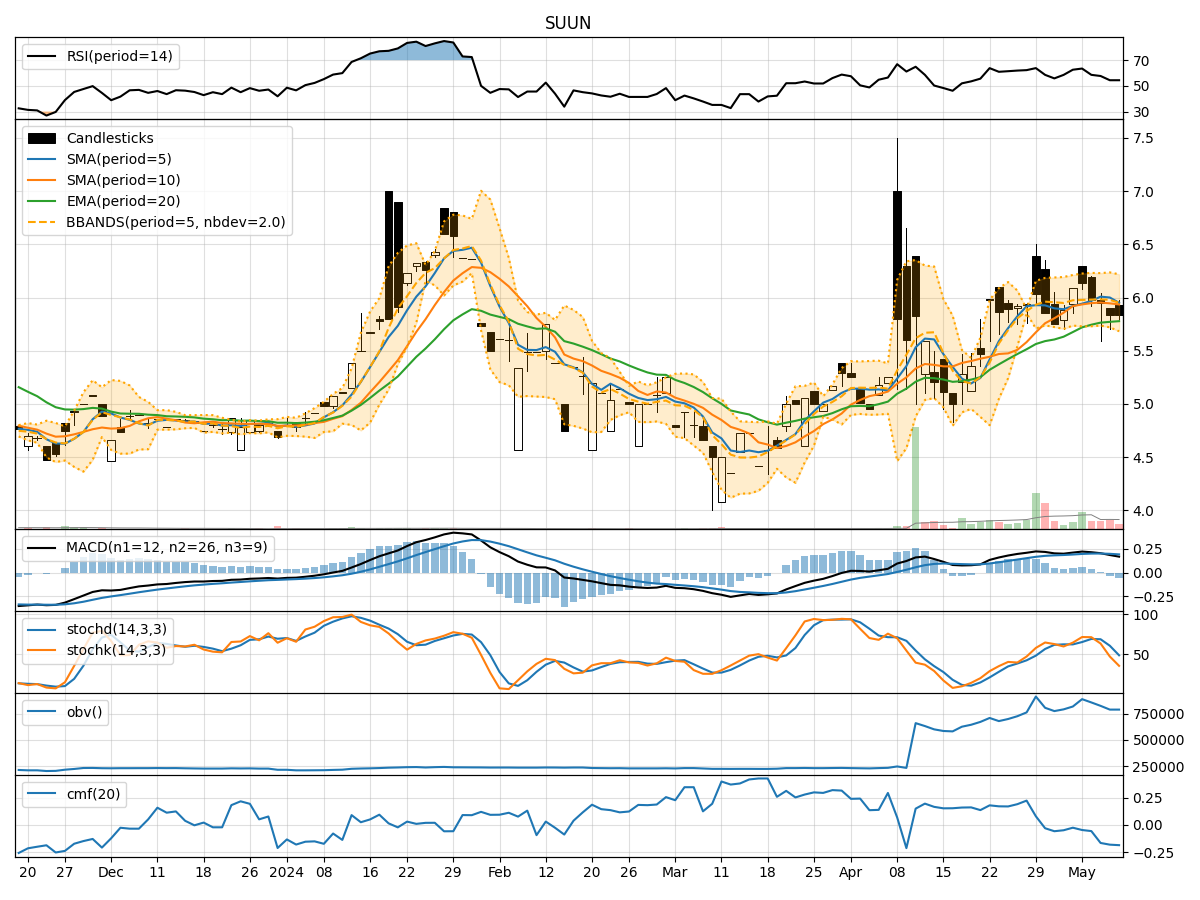
In analyzing the technical indicators for SUUN over the last 5 days, we will delve into the trend, momentum, volatility, and volume indicators to provide a comprehensive outlook on the possible stock price movement in the coming days.
Trend Analysis:
- Moving Averages (MA): The 5-day MA has been fluctuating around the current price, indicating a lack of clear trend direction.
- MACD: The MACD line has been positive, but the MACD Histogram has been decreasing, suggesting a potential weakening of the bullish momentum.
- EMA: The EMA has been gradually increasing, indicating a positive trend in the longer term.
Momentum Analysis:
- RSI: The RSI has been fluctuating in the neutral zone, indicating indecision in the market.
- Stochastic Oscillator: Both %K and %D have been declining, signaling a potential bearish momentum.
- Williams %R: The indicator has been in oversold territory, suggesting a possible reversal.
Volatility Analysis:
- Bollinger Bands (BB): The bands have been narrowing, indicating decreasing volatility and a potential upcoming breakout.
- Bollinger %B: The %B has been fluctuating around the middle band, suggesting a balanced market sentiment.
Volume Analysis:
- On-Balance Volume (OBV): The OBV has been declining, indicating selling pressure in the market.
- Chaikin Money Flow (CMF): The CMF has been negative, suggesting outflow of money from the stock.
Key Observations:
- The trend indicators show a mixed picture with a potential weakening of bullish momentum.
- Momentum indicators suggest a lack of clear direction with a possible bearish bias.
- Volatility indicators point towards decreasing volatility and a potential breakout.
- Volume indicators indicate selling pressure and a negative money flow.
Conclusion:
Based on the analysis of the technical indicators, the stock price of SUUN is likely to experience further downward movement in the coming days. The weakening trend indicators, bearish momentum signals, decreasing volatility, and negative volume indicators all point towards a bearish outlook for the stock. Traders and investors should exercise caution and consider short-term selling strategies or wait for a clearer trend reversal signal before considering long positions.