Technical Analysis of SWIN 2024-05-10
Overview:
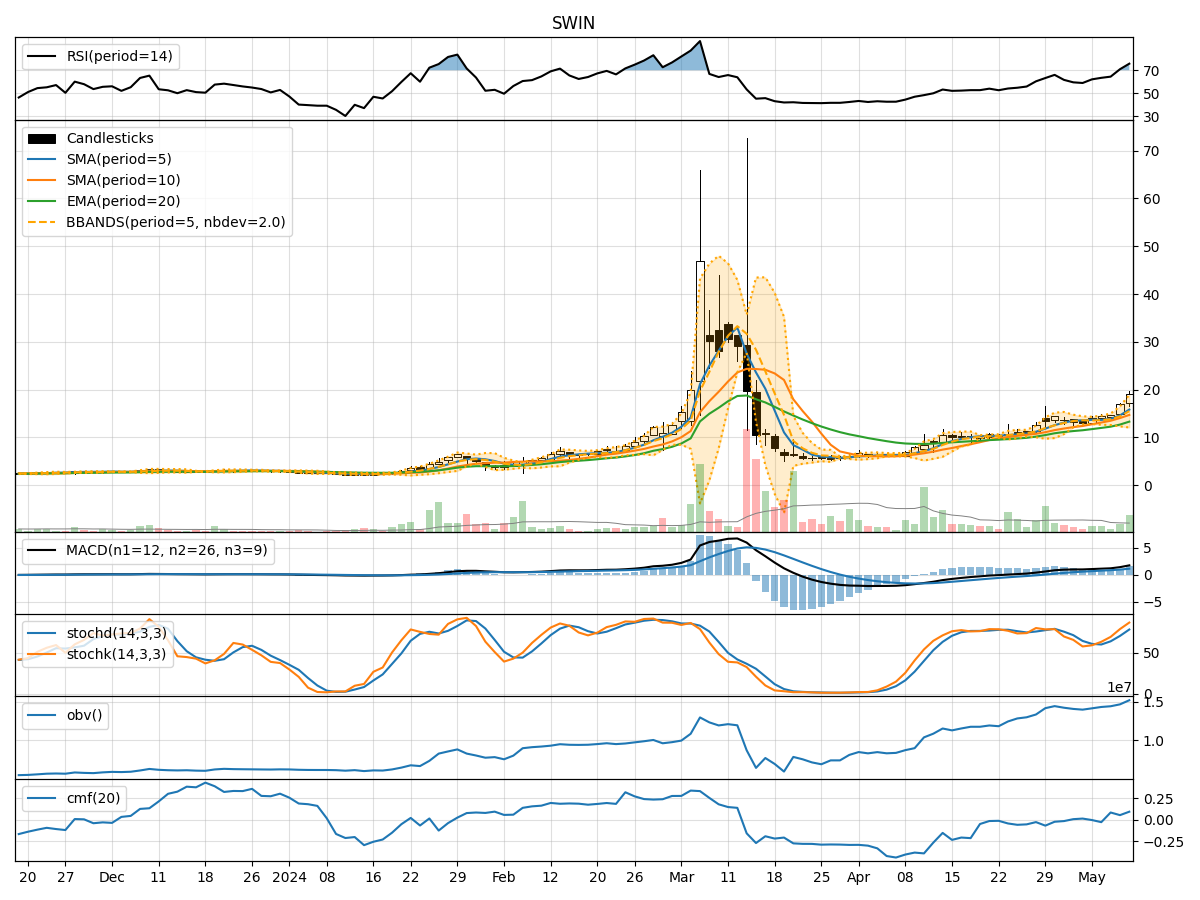
In analyzing the technical indicators for SWIN stock over the last 5 days, we will delve into the trend, momentum, volatility, and volume indicators to provide a comprehensive outlook on the possible stock price movement in the coming days.
Trend Indicators:
- Moving Averages (MA): The 5-day MA has been consistently above the closing prices, indicating an upward trend. The Simple Moving Average (SMA) and Exponential Moving Average (EMA) also show increasing values, supporting the bullish trend.
- MACD: The MACD line has been above the signal line for all 5 days, with both lines showing an upward trajectory. The MACD Histogram is also positive, suggesting bullish momentum.
Momentum Indicators:
- RSI: The Relative Strength Index (RSI) has been trending upwards and is currently in the overbought zone, indicating strong buying momentum.
- Stochastic Oscillator: Both %K and %D lines are in the overbought region, suggesting a strong bullish sentiment.
- Williams %R: The indicator is in the oversold region, indicating a potential reversal in the short term.
Volatility Indicators:
- Bollinger Bands: The bands have been widening, indicating increased volatility. The current price is near the upper band, suggesting a bullish sentiment.
- Bollinger %B: The %B value is above 0.8, indicating that the stock is trading near the upper band, which could signal a potential pullback.
Volume Indicators:
- On-Balance Volume (OBV): The OBV has been steadily increasing, indicating accumulation by investors.
- Chaikin Money Flow (CMF): The CMF is positive, suggesting buying pressure in the stock.
Key Observations:
- The trend indicators, momentum indicators, and volume indicators all point towards a bullish outlook for SWIN stock.
- The stock is currently in an uptrend supported by strong buying momentum and increasing volume.
- Volatility has also increased, which could lead to short-term price fluctuations.
Conclusion:
Based on the analysis of the technical indicators, it is highly likely that SWIN stock will continue its upward trajectory in the coming days. Investors should consider buying opportunities in line with the bullish sentiment reflected across various indicators. However, it is essential to monitor the stock closely for any signs of overbought conditions or potential pullbacks indicated by the Bollinger Bands and Williams %R. Overall, the outlook for SWIN stock is bullish in the near term.