Technical Analysis of SWKS 2024-05-10
Overview:
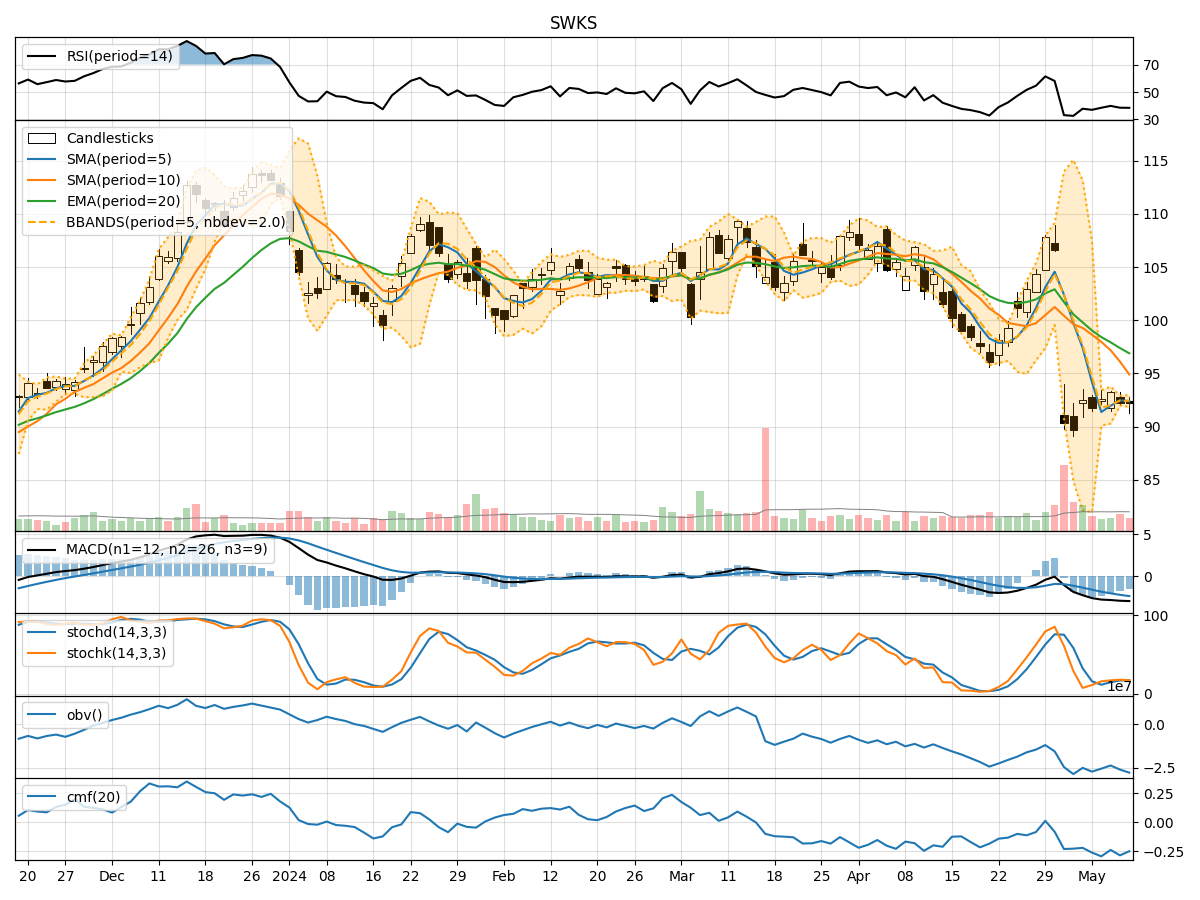
In the last 5 trading days, Skyworks Solutions Inc. (SWKS) has shown a mixed performance based on various technical indicators. The stock price has fluctuated within a certain range, and different indicators are signaling varying trends. By analyzing the trend, momentum, volatility, and volume indicators, we can gain insights into the possible future movements of SWKS stock price.
Trend Indicators:
- Moving Averages (MA): The 5-day MA is below the 10-day SMA and 20-day EMA, indicating a short-term bearish trend.
- MACD: The MACD line is below the signal line, suggesting a bearish momentum.
- MACD Histogram: The histogram is negative, indicating a decreasing bearish momentum.
Momentum Indicators:
- RSI: The RSI is below 50, indicating a bearish momentum.
- Stochastic Oscillator: Both %K and %D are below 20, suggesting an oversold condition.
- Williams %R: The indicator is below -80, signaling an oversold condition.
Volatility Indicators:
- Bollinger Bands (BB): The stock price is currently trading near the lower Bollinger Band, indicating a potential oversold condition.
- Bollinger %B: The %B is below 1, suggesting a possible buying opportunity.
Volume Indicators:
- On-Balance Volume (OBV): The OBV has been decreasing, indicating selling pressure.
- Chaikin Money Flow (CMF): The CMF is negative, suggesting a bearish trend in money flow.
Key Observations and Opinions:
- Trend: The trend indicators show a bearish sentiment in the short term.
- Momentum: Momentum indicators suggest an oversold condition, but the overall momentum is bearish.
- Volatility: Volatility indicators point towards a potential buying opportunity as the stock price nears the lower Bollinger Band.
- Volume: Volume indicators indicate selling pressure and a bearish trend in money flow.
Conclusion:
Based on the analysis of the technical indicators, the next few days' possible stock price movement for SWKS is likely to continue in a downward direction. The bearish trend, negative momentum, and selling pressure indicated by the volume indicators suggest that the stock price may experience further declines. Traders and investors should exercise caution and consider waiting for a more favorable entry point before considering any long positions.