Technical Analysis of SYM 2024-05-10
Overview:
In analyzing the technical indicators for the stock symbol (SYM) over the last 5 days, we will delve into the trends, momentum, volatility, and volume indicators to provide a comprehensive outlook on the possible stock price movement in the upcoming days. By examining these key aspects, we aim to offer valuable insights and predictions to guide your investment decisions.
Trend Analysis:
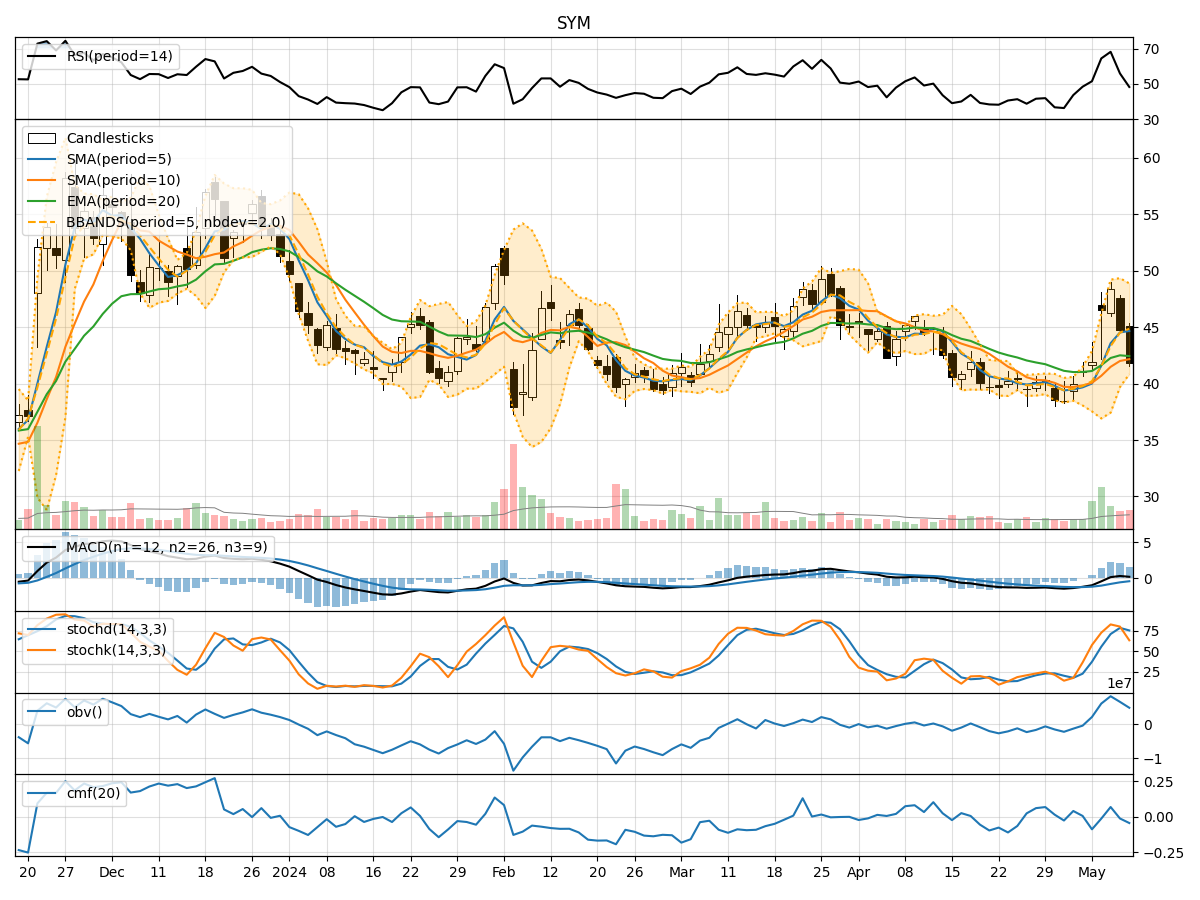
- Moving Averages (MA): The 5-day Moving Average (MA) has been trending upwards, indicating a positive momentum in the short term.
- MACD and Signal Line: The MACD line has been consistently above the Signal Line, suggesting a bullish trend.
- Relative Strength Index (RSI): The RSI values have been fluctuating but generally staying within the neutral range, indicating a balanced market sentiment.
Momentum Analysis:
- Stochastic Oscillator: The Stochastic Oscillator has been in the overbought territory, suggesting a potential reversal or consolidation phase.
- Williams %R (Willr): The Williams %R values have been in the oversold region, indicating a possible buying opportunity.
Volatility Analysis:
- Bollinger Bands (BB): The stock price has been trading within the Bollinger Bands, with the bands narrowing, indicating a potential decrease in volatility.
- Bollinger Band %B (bbp): The %B values have been decreasing, suggesting a consolidation phase.
Volume Analysis:
- On-Balance Volume (OBV): The OBV has been fluctuating, indicating mixed buying and selling pressure.
- Chaikin Money Flow (CMF): The CMF values have been negative, indicating a slight outflow of money from the stock.
Conclusion:
Based on the analysis of the technical indicators, the stock symbol (SYM) is likely to experience sideways movement in the next few days. The trend indicators suggest a bullish bias in the short term, supported by the positive momentum and relatively stable RSI. However, the overbought Stochastic Oscillator and oversold Williams %R signal a potential consolidation phase or a minor pullback. The decreasing volatility and mixed volume signals further support the view of sideways movement.
In conclusion, while the overall trend remains bullish, investors should be cautious of potential consolidation or sideways movement in the near future. It is advisable to closely monitor key support and resistance levels along with any significant developments in the market that could impact the stock price movement.