Technical Analysis of TBBK 2024-05-10
Overview:
In analyzing the technical indicators for TBBK over the last 5 days, we will delve into the trend, momentum, volatility, and volume indicators to provide a comprehensive outlook on the possible stock price movement in the coming days. By examining these key aspects, we aim to offer valuable insights and predictions for informed decision-making.
Trend Analysis:
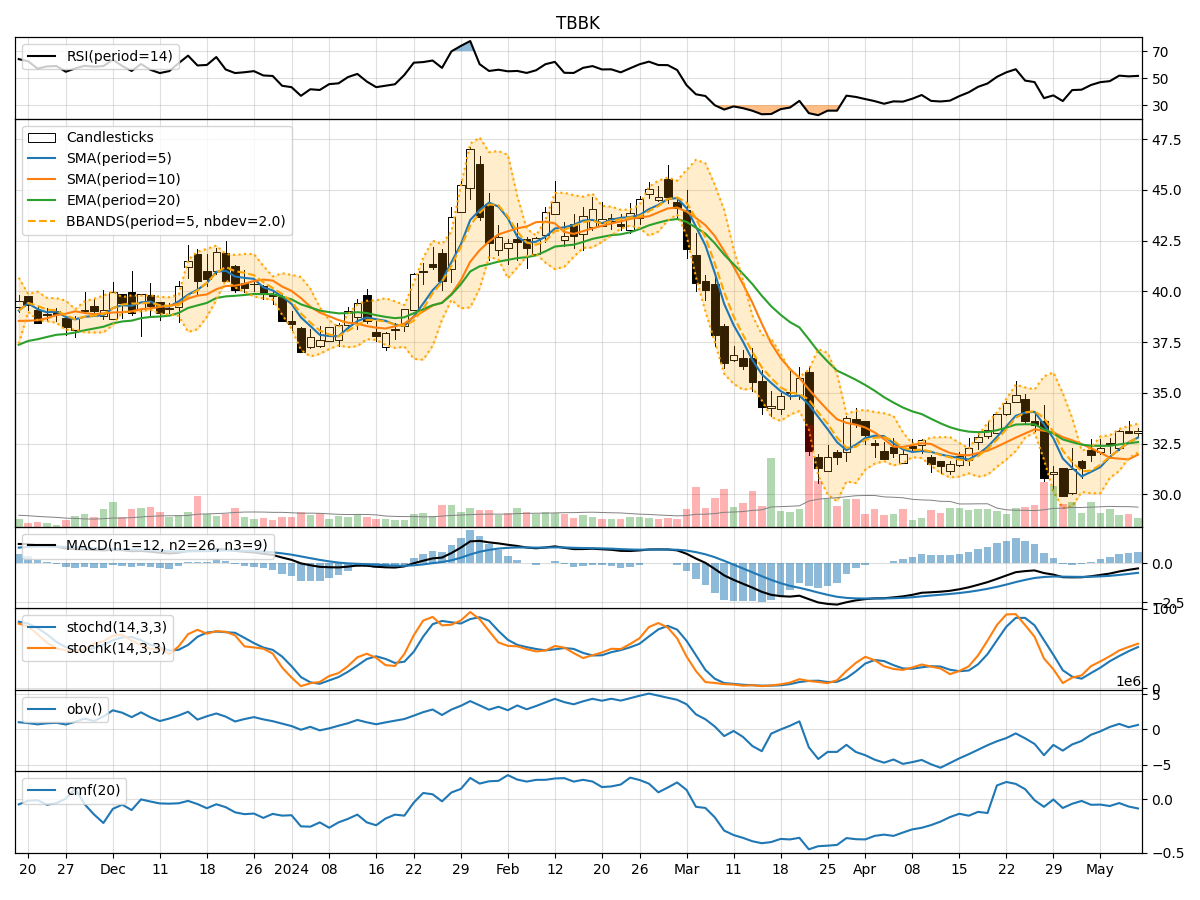
- Moving Averages (MA): The 5-day Moving Average (MA) has been consistently above the Simple Moving Average (SMA) and Exponential Moving Average (EMA), indicating a short-term uptrend.
- MACD: The MACD line has been negative but converging towards the signal line, suggesting a potential reversal in the downtrend.
- Conclusion: The trend is showing signs of a potential reversal from the recent downtrend towards a more bullish sentiment.
Momentum Analysis:
- RSI: The Relative Strength Index (RSI) has been hovering around the neutral zone, indicating a balanced momentum.
- Stochastic Oscillator: Both %K and %D have been rising, reflecting increasing buying pressure.
- Conclusion: Momentum is gradually shifting towards the bullish side, indicating a potential uptrend in the stock price.
Volatility Analysis:
- Bollinger Bands (BB): The stock price has been trading within the bands, with the %B indicator showing price nearing the upper band.
- Conclusion: Volatility is relatively stable, but the proximity to the upper Bollinger Band suggests a potential breakout or continuation of the uptrend.
Volume Analysis:
- On-Balance Volume (OBV): The OBV has been declining, indicating a decrease in buying volume.
- Chaikin Money Flow (CMF): The CMF has been negative, signaling a lack of buying pressure.
- Conclusion: Volume indicators suggest a weakening buying interest, which could potentially limit the upside movement in the stock price.
Overall Conclusion:
Based on the analysis of trend, momentum, volatility, and volume indicators, the stock price of TBBK is likely to experience a short-term bullish movement in the coming days. The trend is showing signs of a reversal from the recent downtrend, supported by increasing buying pressure and a potential breakout indicated by the Bollinger Bands. However, the weakening volume indicators raise some concerns about the sustainability of this bullish momentum.
Recommendation:
- Short-term Traders: Consider entering long positions with tight stop-loss levels to capitalize on the potential bullish movement.
- Long-term Investors: Monitor the volume closely for confirmation of sustained buying interest before committing to long-term positions.
Disclaimer:
Remember that market dynamics can change rapidly, and it is essential to monitor the indicators regularly for any shifts in trend or momentum. Additionally, consider incorporating fundamental analysis and risk management strategies into your decision-making process for a well-rounded investment approach.