Technical Analysis of TC 2024-05-10
Overview:
In analyzing the provided Technical Analysis (TA) data for the last 5 days, we will delve into the trend, momentum, volatility, and volume indicators to forecast the possible stock price movement for the next few days. By examining these key indicators, we aim to provide a comprehensive and insightful prediction backed by data-driven analysis.
Trend Indicators:
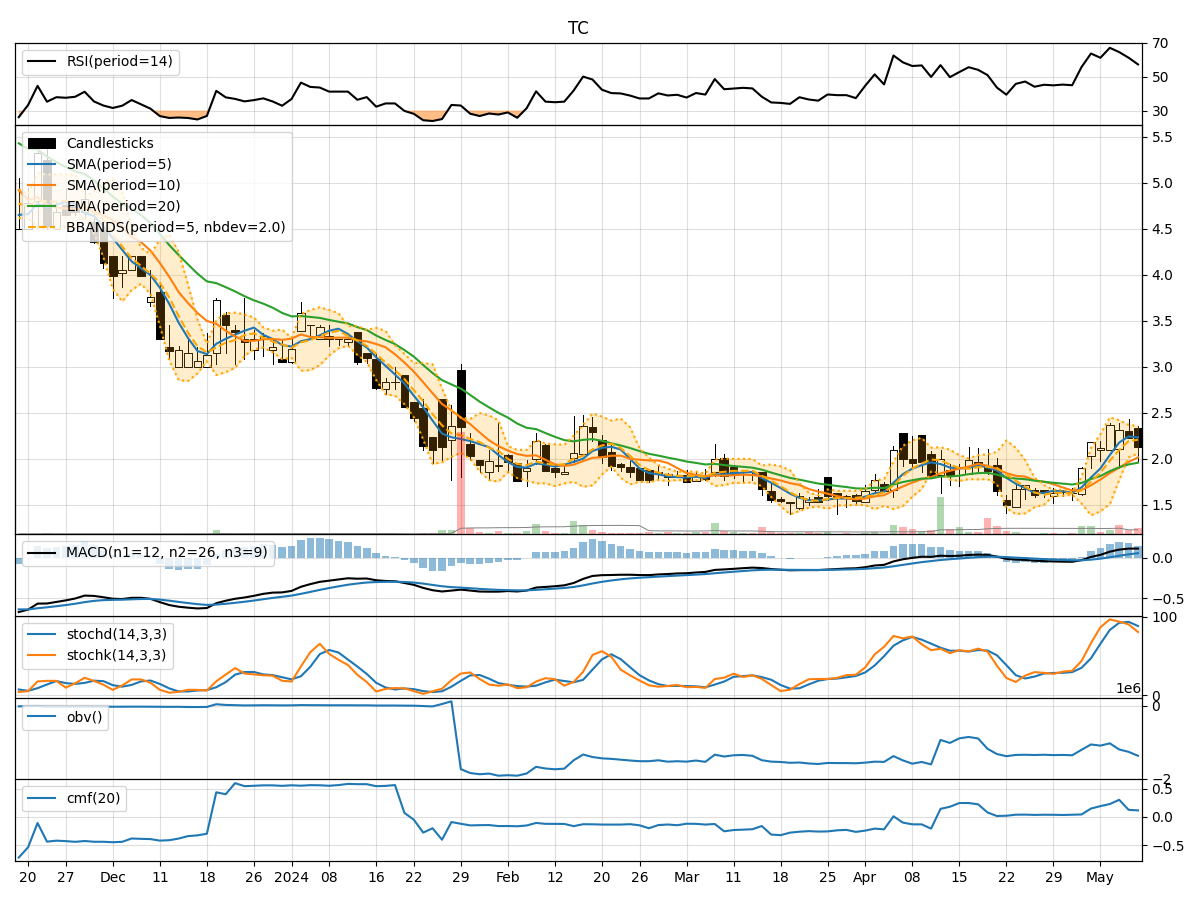
- Moving Averages (MA): The 5-day Moving Average (MA) has been consistently above the Simple Moving Average (SMA) and Exponential Moving Average (EMA), indicating a bullish trend.
- MACD: The MACD line has been consistently above the signal line, with the MACD Histogram showing an increasing positive trend, suggesting bullish momentum.
Momentum Indicators:
- RSI: The Relative Strength Index (RSI) has been fluctuating around the 60-70 range, indicating a neutral to slightly bullish momentum.
- Stochastic Oscillator: Both %K and %D have been in the overbought zone, suggesting a potential reversal or consolidation.
Volatility Indicators:
- Bollinger Bands (BB): The stock price has been trading within the Bollinger Bands, with the bands narrowing, indicating decreasing volatility.
- Bollinger %B: The %B indicator has been hovering around 0.7-0.8, suggesting the stock is trading closer to the upper band.
Volume Indicators:
- On-Balance Volume (OBV): The OBV has shown a slight decrease over the last few days, indicating some distribution.
- Chaikin Money Flow (CMF): The CMF has been positive but decreasing, suggesting weakening buying pressure.
Key Observations and Opinions:
- Trend: The stock is in a strong bullish trend based on moving averages and MACD.
- Momentum: The RSI indicates a neutral to slightly bullish momentum, while the Stochastic Oscillator signals potential overbought conditions.
- Volatility: Volatility has been decreasing, indicating a possible period of consolidation.
- Volume: The OBV decrease suggests some distribution, while the CMF shows weakening buying pressure.
Conclusion:
Based on the analysis of the technical indicators, the next few days' possible stock price movement is likely to be sideways or consolidating with a slight bullish bias. Traders should watch for potential reversal signals as the stock may be nearing overbought levels. It is advisable to wait for confirmation from key indicators before making any significant trading decisions.