Technical Analysis of TCBP 2024-05-10
Overview:
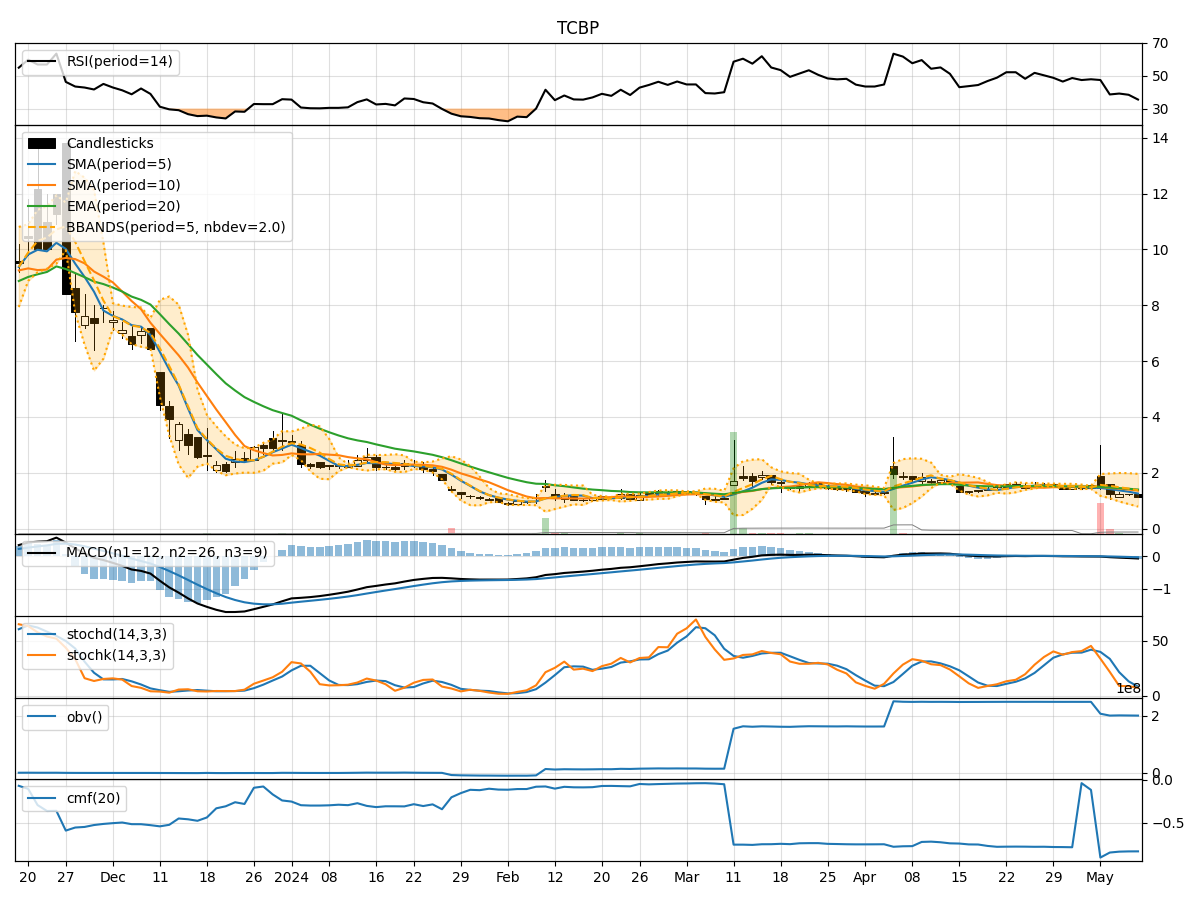
In the last 5 trading days, TCBP stock has shown a downward trend in both price and volume. The moving averages (MA) have been declining, indicating a bearish trend. Momentum indicators like RSI and Stochastic Oscillator are also showing oversold conditions. Volatility has been decreasing, and volume indicators are also on a downward trend. Based on these technical indicators, the stock is currently in a bearish phase.
Trend Analysis:
- Moving Averages (MA): The 5-day MA has been consistently decreasing, indicating a downward trend in the stock price.
- MACD: The MACD line has been below the signal line, and both are in negative territory, suggesting a bearish momentum.
- EMA: The EMA has been declining, further confirming the bearish trend.
Momentum Analysis:
- RSI: The RSI has been below 50, indicating bearish momentum and potential oversold conditions.
- Stochastic Oscillator: Both %K and %D are in oversold territory, suggesting a potential reversal or consolidation.
Volatility Analysis:
- Bollinger Bands (BB): The bands have been narrowing, indicating decreasing volatility and a possible period of consolidation.
- Bollinger %B: The %B has been decreasing, showing that the stock price is closer to the lower band.
Volume Analysis:
- On-Balance Volume (OBV): The OBV has been declining, indicating selling pressure and a bearish sentiment.
- Chaikin Money Flow (CMF): The CMF has been negative, suggesting that money is flowing out of the stock.
Key Observations:
- The stock is currently in a bearish phase, with downward trends in price, volume, and momentum indicators.
- The oversold conditions in RSI and Stochastic Oscillator may indicate a potential reversal or consolidation in the near future.
- Volatility has been decreasing, suggesting a period of consolidation or sideways movement.
- The OBV and CMF both indicate a bearish sentiment in the market.
Conclusion:
Based on the technical indicators and analysis: - The next few days' possible stock price movement is likely to be downward. - The stock is currently in a bearish phase, and unless there is a significant shift in market sentiment or positive news catalyst, the downward trend is expected to continue. - Traders and investors should exercise caution and consider waiting for more favorable technical signals before considering any long positions. - It is advisable to closely monitor key support levels and potential reversal patterns for any signs of a trend change.
Disclaimer:
Remember that technical analysis is not a guaranteed predictor of future price movements, and other fundamental factors can influence stock prices. It is essential to conduct thorough research and consider multiple indicators before making any investment decisions. Consulting with a financial advisor can provide tailored insights based on your specific investment goals and risk tolerance level.