Technical Analysis of TER 2024-05-10
Overview:
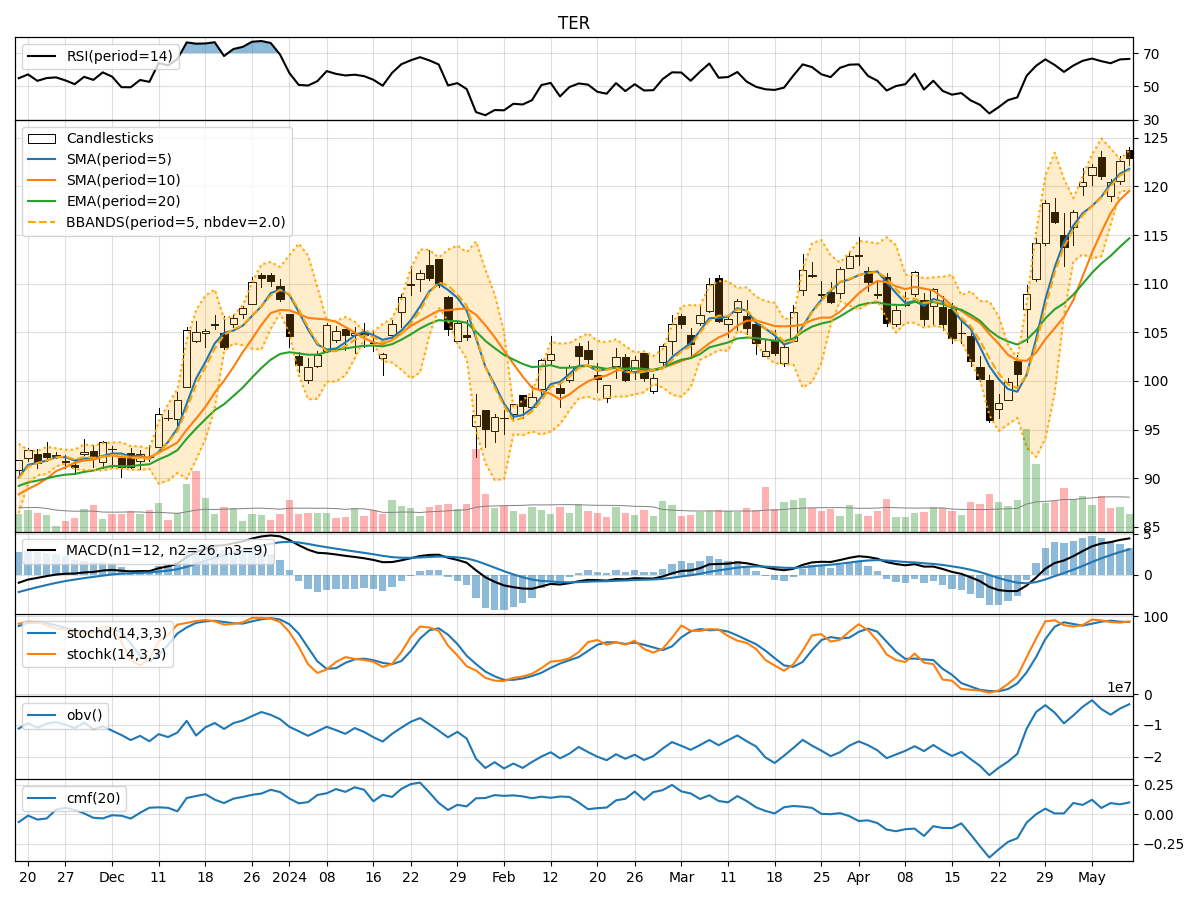
In analyzing the technical indicators for TER over the last 5 days, we will delve into the trend, momentum, volatility, and volume indicators to provide a comprehensive outlook on the possible stock price movement in the coming days.
Trend Analysis:
- Moving Averages (MA): The 5-day Moving Average (MA) has been consistently above the 10-day Simple Moving Average (SMA), indicating a short-term bullish trend.
- Exponential Moving Average (EMA): The EMA has been steadily increasing, reflecting positive price momentum.
- MACD: The MACD line has been above the signal line, suggesting bullish momentum in the stock price.
Momentum Analysis:
- RSI: The Relative Strength Index (RSI) has been in the overbought territory, indicating a potential reversal or consolidation.
- Stochastic Oscillator: Both %K and %D have been relatively high, signaling a strong upward momentum.
- Williams %R: The Williams %R is in the oversold region, suggesting a possible reversal in the short term.
Volatility Analysis:
- Bollinger Bands (BB): The stock price has been trading within the Bollinger Bands, indicating normal volatility.
- Bollinger Band Width (BBW): The BBW has been relatively stable, suggesting consistent price movement.
- Bollinger Band %B (BBP): The %B indicator has been fluctuating within the bands, reflecting normal price action.
Volume Analysis:
- On-Balance Volume (OBV): The OBV has shown mixed signals, indicating indecision among investors.
- Chaikin Money Flow (CMF): The CMF has been positive, suggesting buying pressure in the stock.
Key Observations:
- The trend indicators point towards a bullish sentiment in the short term.
- Momentum indicators show conflicting signals with RSI in overbought territory and Williams %R in oversold region.
- Volatility remains stable with no significant spikes or drops.
- Volume indicators indicate mixed investor sentiment with OBV showing no clear direction.
Conclusion:
Based on the analysis of the technical indicators, the next few days' possible stock price movement for TER is likely to be bullish in the short term. However, caution is advised as conflicting signals in momentum indicators could lead to a potential reversal or consolidation. Investors should closely monitor key levels and wait for confirmation before making trading decisions.