Technical Analysis of TGAA 2024-05-10
Overview:
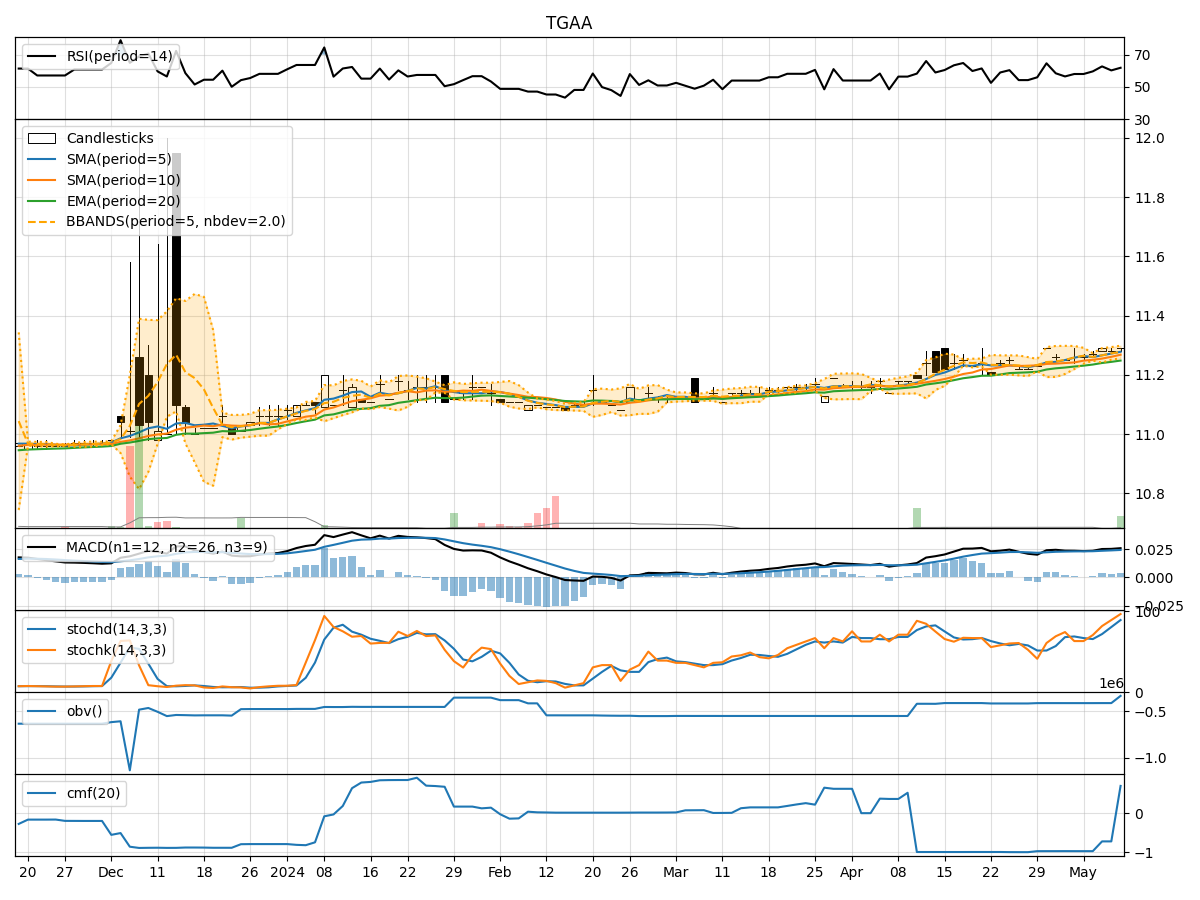
In analyzing the technical indicators for TGAA over the last 5 days, we will delve into the trend, momentum, volatility, and volume indicators to provide a comprehensive outlook on the possible stock price movement in the coming days. By examining these key aspects, we aim to offer valuable insights and predictions for informed decision-making.
Trend Analysis:
- Moving Averages (MA): The 5-day Moving Average (MA) has been steadily increasing, indicating a positive trend in the stock price.
- MACD: The Moving Average Convergence Divergence (MACD) has shown consistent growth, suggesting bullish momentum in the stock.
Momentum Analysis:
- RSI: The Relative Strength Index (RSI) has been fluctuating around the neutral zone, indicating a balanced momentum in the stock.
- Stochastic Oscillator: Both %K and %D values have been rising, signaling increasing buying pressure and potential upward momentum.
Volatility Analysis:
- Bollinger Bands (BB): The Bollinger Bands have been widening, suggesting increased price volatility in the stock.
Volume Analysis:
- On-Balance Volume (OBV): The OBV has shown a significant increase in volume, indicating strong buying interest in the stock.
- Chaikin Money Flow (CMF): The CMF has been negative, reflecting a bearish money flow in the stock.
Key Observations:
- The trend indicators point towards a bullish sentiment with rising moving averages and positive MACD values.
- Momentum indicators suggest a mixed outlook with RSI hovering around neutrality but stochastic indicators showing bullish momentum.
- Volatility indicators indicate an increase in price volatility, which could lead to significant price movements.
- Volume indicators highlight a surge in buying volume, supporting the bullish case for the stock.
Conclusion:
Based on the analysis of the technical indicators, the next few days' possible stock price movement for TGAA is upward. The bullish trend, positive momentum signals, increased volatility, and strong buying volume all point towards a potential price increase in the coming days. Traders and investors may consider taking long positions or holding onto existing positions to capitalize on the expected upward movement in TGAA's stock price.