Technical Analysis of THTX 2024-05-10
Overview:
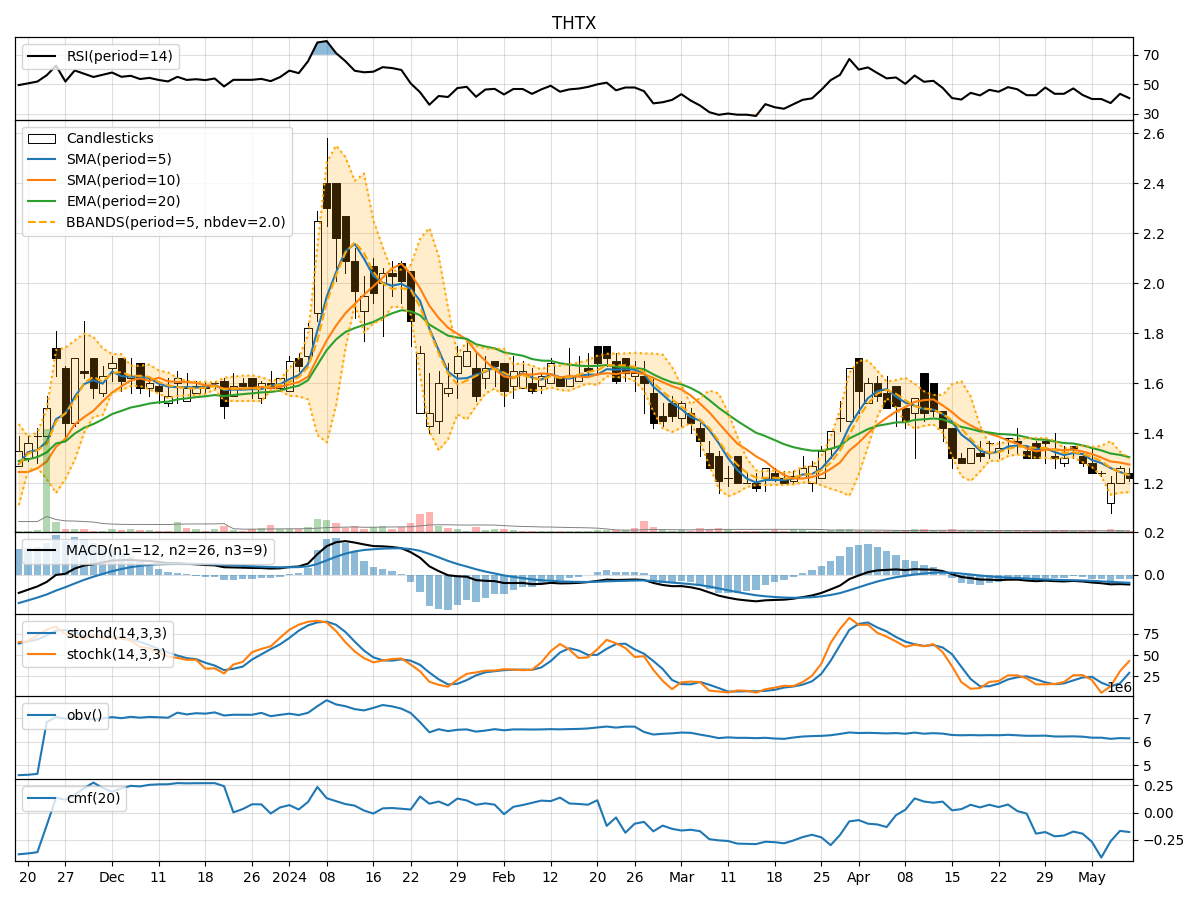
In analyzing the technical indicators for THTX over the last 5 days, we will delve into the trend, momentum, volatility, and volume indicators to provide a comprehensive outlook on the possible stock price movement. By examining these key factors, we aim to offer valuable insights and predictions for the upcoming days.
Trend Analysis:
- Moving Averages (MA): The 5-day MA has been consistently below the closing price, indicating a short-term bearish trend.
- MACD: The MACD line has been below the signal line, suggesting a bearish momentum in the stock.
Key Observation: The trend indicators point towards a downward trend in the stock price.
Momentum Analysis:
- RSI: The RSI has been hovering around 40, indicating a neutral momentum in the stock.
- Stochastic Oscillator: Both %K and %D have shown mixed signals, with %K crossing above %D recently.
Key Observation: The momentum indicators suggest a neutral stance in the stock price movement.
Volatility Analysis:
- Bollinger Bands (BB): The stock price has been trading within the lower Bollinger Band, indicating a potential oversold condition.
Key Observation: Volatility indicators suggest a potential reversal in the stock price movement.
Volume Analysis:
- On-Balance Volume (OBV): The OBV has been declining, indicating selling pressure in the stock.
- Chaikin Money Flow (CMF): The CMF has been negative, reflecting a lack of buying interest.
Key Observation: Volume indicators signal a bearish sentiment in the stock.
Conclusion:
Based on the analysis of trend, momentum, volatility, and volume indicators, the overall outlook for THTX in the next few days is bearish. The trend indicators show a downward trajectory, while momentum remains neutral. Volatility indicators suggest a potential reversal, but volume indicators indicate selling pressure.
Recommendation:
Considering the bearish outlook, investors should exercise caution and consider waiting for more definitive signals before entering a position. It is advisable to closely monitor the stock price movement and key technical indicators for any signs of a reversal or confirmation of the bearish trend.
Disclaimer:
This analysis is based solely on technical indicators and historical data, and it is essential to consider other fundamental factors and market dynamics before making any investment decisions. Consulting with a financial advisor or conducting further research is recommended to make well-informed investment choices.