Technical Analysis of TIGR 2024-05-10
Overview:
In analyzing the technical indicators for TIGR over the last 5 days, we will delve into the trend, momentum, volatility, and volume indicators to provide a comprehensive outlook on the possible stock price movement in the coming days. By examining these key aspects, we aim to offer valuable insights and predictions to guide your investment decisions.
Trend Analysis:
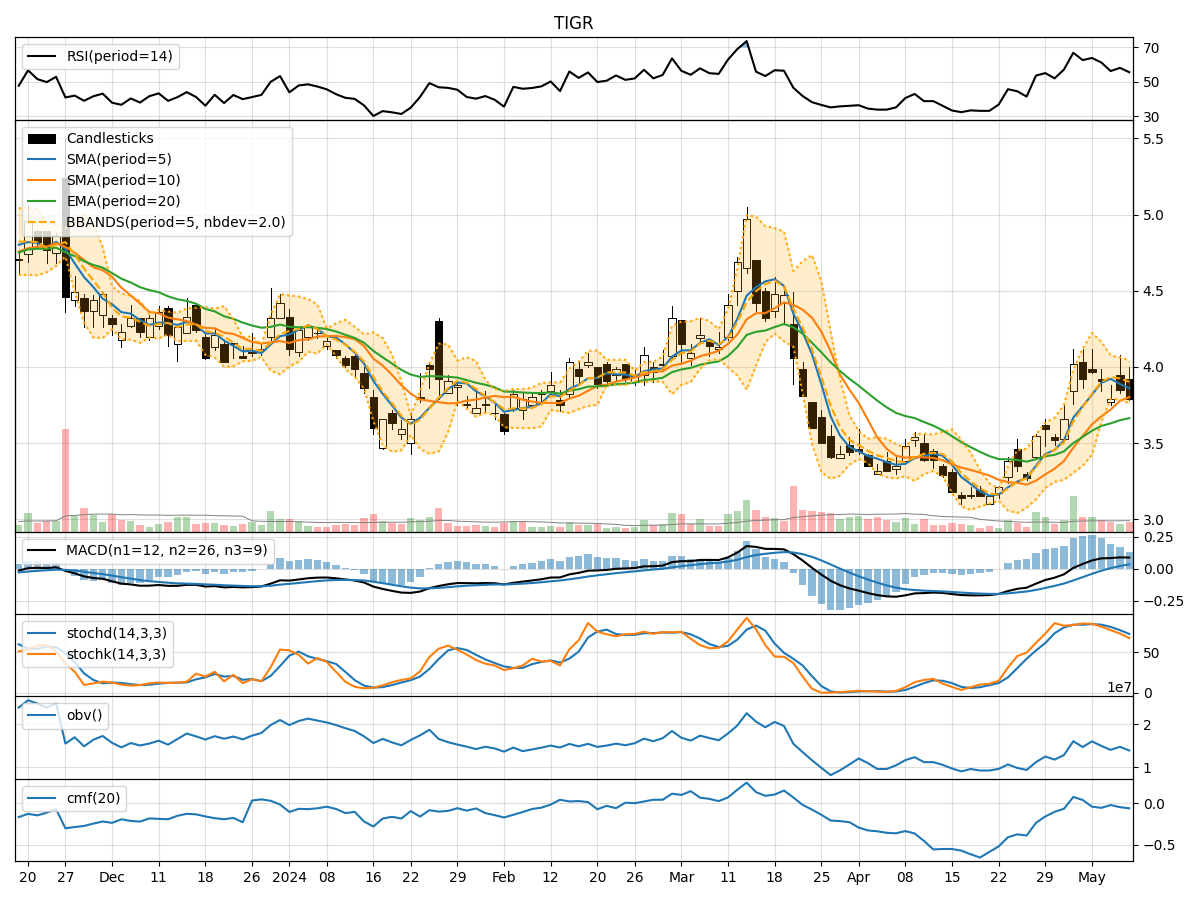
- Moving Averages (MA): The 5-day Moving Average (MA) has been fluctuating around the closing prices, indicating short-term price trends. The Simple Moving Average (SMA) and Exponential Moving Average (EMA) show an overall uptrend, suggesting a positive momentum.
- MACD: The Moving Average Convergence Divergence (MACD) and its signal line have been positive, indicating a bullish trend. The MACD Histogram has been increasing, supporting the uptrend.
Momentum Analysis:
- RSI: The Relative Strength Index (RSI) has been oscillating in the neutral zone, suggesting a balanced momentum without extreme overbought or oversold conditions.
- Stochastic Oscillator: Both %K and %D lines of the Stochastic Oscillator have been declining, indicating a potential reversal in momentum towards the downside.
- Williams %R: The Williams %R is in the oversold territory, signaling a possible buying opportunity in the near term.
Volatility Analysis:
- Bollinger Bands: The Bollinger Bands have been narrowing, indicating decreasing volatility. The bands are currently close to the price, suggesting a potential breakout or significant price movement.
- Bollinger %B: The %B indicator is hovering around the middle range, indicating a neutral stance in terms of volatility.
Volume Analysis:
- On-Balance Volume (OBV): The OBV has been fluctuating, reflecting mixed buying and selling pressure. The recent decrease in OBV suggests some distribution of shares.
- Chaikin Money Flow (CMF): The CMF has been negative, indicating outflows and potential weakness in buying pressure.
Conclusion:
Based on the analysis of the technical indicators, the stock of TIGR is likely to experience sideways consolidation in the near term. The trend indicators suggest a bullish bias, supported by positive moving averages and MACD. However, the momentum indicators show a potential reversal in momentum towards the downside, as indicated by the Stochastic Oscillator and Williams %R.
The volatility is decreasing, implying a period of consolidation before a potential breakout. The volume indicators reflect mixed signals, with OBV showing distribution while CMF indicates weakness in buying pressure.
In conclusion, while the trend remains bullish, caution is advised due to the conflicting signals from momentum and volume indicators. Traders should closely monitor key support and resistance levels for potential entry or exit points.