Technical Analysis of TIRX 2024-05-10
Overview:
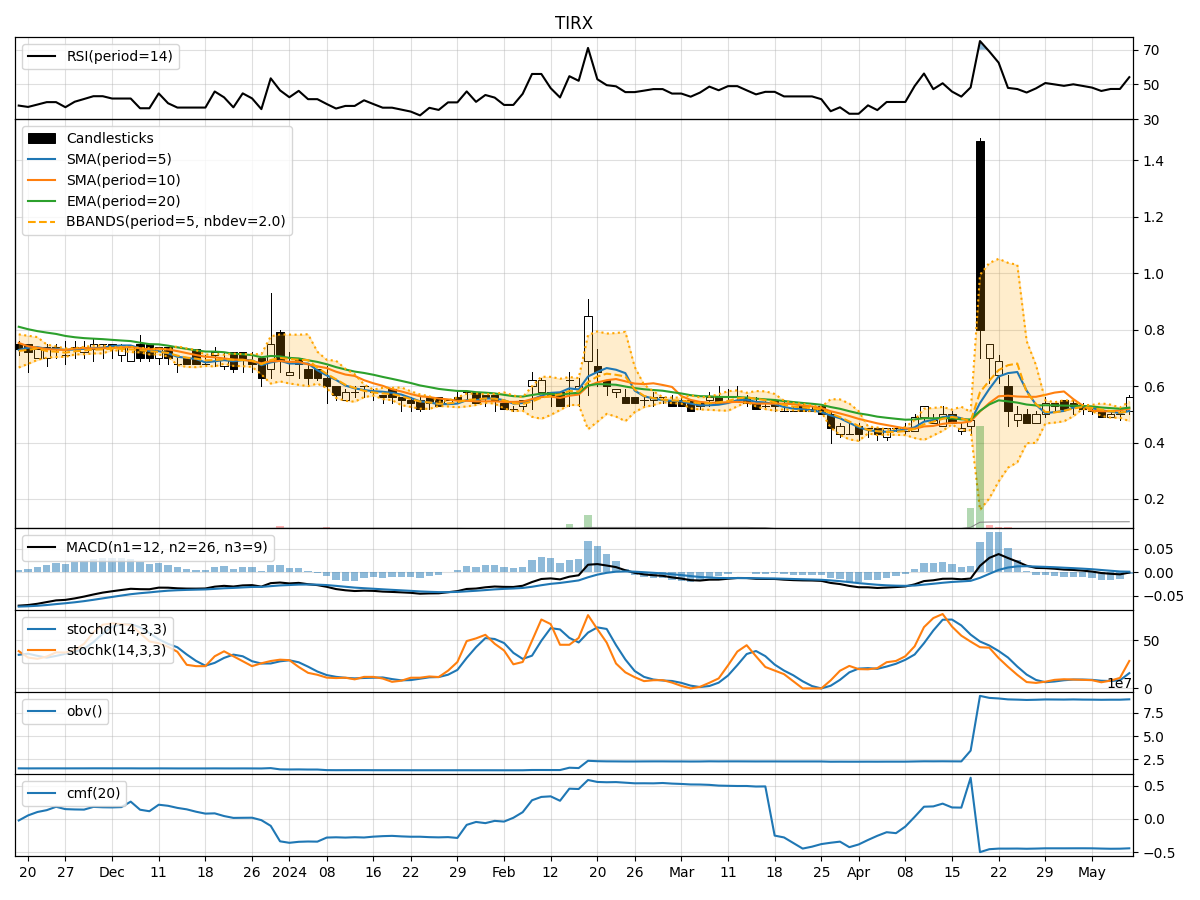
In analyzing the technical indicators for TIRX over the last 5 days, we will delve into the trend, momentum, volatility, and volume indicators to provide a comprehensive outlook on the possible stock price movement in the coming days. By examining these key aspects, we aim to offer valuable insights and predictions to guide your investment decisions.
Trend Analysis:
- Moving Averages (MA): The 5-day MA has been fluctuating around the closing prices, indicating short-term price trends. The SMA(10) and EMA(20) have shown a slight downward trend, suggesting a potential bearish sentiment.
- MACD: The MACD line has been consistently below the signal line, indicating a bearish trend. The MACD histogram has also been negative, further supporting a bearish outlook.
Momentum Analysis:
- RSI: The RSI has been hovering around the mid-range, indicating a neutral sentiment without any extreme overbought or oversold conditions.
- Stochastic Oscillator: Both %K and %D have shown some upward movement but remain in oversold territory, suggesting a potential reversal in the short term.
- Williams %R: The indicator has moved from extreme oversold levels towards a more neutral zone, signaling a possible shift in momentum.
Volatility Analysis:
- Bollinger Bands: The stock price has been trading within the lower Bollinger Band, indicating a period of lower volatility. The bands are narrowing, suggesting a potential breakout or significant price movement in the near future.
Volume Analysis:
- On-Balance Volume (OBV): The OBV has been relatively flat, indicating a balance between buying and selling pressure.
- Chaikin Money Flow (CMF): The CMF has been negative, reflecting a net outflow of money from the stock.
Key Observations:
- The trend indicators point towards a bearish sentiment, with moving averages and MACD signaling a potential downward trend.
- Momentum indicators suggest a possible reversal in the short term, as the stochastic oscillator and Williams %R show signs of bottoming out.
- Volatility is low, but the narrowing Bollinger Bands indicate an impending breakout or significant price movement.
- Volume indicators reflect a balanced market sentiment, with no clear accumulation or distribution pattern.
Conclusion:
Based on the analysis of the technical indicators, the overall outlook for TIRX in the next few days leans towards a bearish trend. While there are indications of a potential short-term reversal in momentum, the trend and volume indicators point towards a continued downward movement. Traders and investors should exercise caution and consider implementing risk management strategies in anticipation of a possible price decline.