Technical Analysis of TKLF 2024-05-10
Overview:
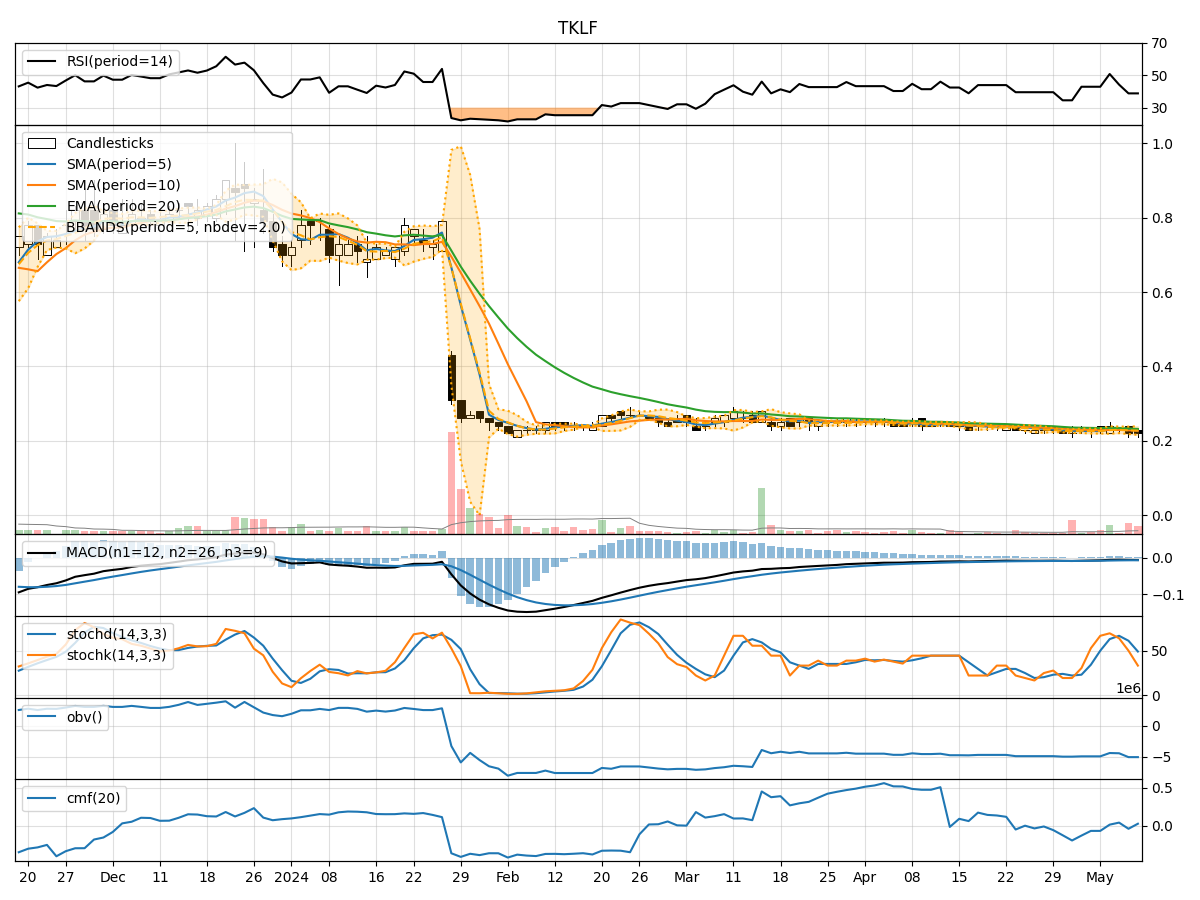
In analyzing the technical indicators for TKLF over the last 5 days, we will delve into the trend, momentum, volatility, and volume indicators to provide a comprehensive outlook on the possible stock price movement in the coming days.
Trend Indicators:
- Moving Averages (MA): The 5-day MA has been fluctuating around the 0.23-0.23 range, indicating a relatively stable price trend.
- MACD: The MACD line has been consistently negative, suggesting a bearish momentum in the short term.
- EMA: The EMA has been declining slightly, reflecting a weakening trend.
Key Observation: The trend indicators point towards a neutral to slightly bearish outlook for TKLF.
Momentum Indicators:
- RSI: The RSI has been hovering around the mid-range, indicating a lack of strong buying or selling pressure.
- Stochastic Oscillator: Both %K and %D have been declining, signaling a potential shift towards oversold conditions.
- Williams %R: The indicator has been consistently in the oversold territory, suggesting a bearish sentiment.
Key Observation: Momentum indicators are showing signs of weakness and bearish sentiment.
Volatility Indicators:
- Bollinger Bands: The bands have been narrowing, indicating decreasing volatility in the stock price.
- Bollinger %B: The %B has been fluctuating within a narrow range, reflecting a lack of significant price movements.
Key Observation: Volatility indicators suggest a period of consolidation and potential price stability.
Volume Indicators:
- On-Balance Volume (OBV): The OBV has been relatively flat, indicating a balance between buying and selling pressure.
- Chaikin Money Flow (CMF): The CMF has been fluctuating around the zero line, suggesting a neutral money flow trend.
Key Observation: Volume indicators point towards a lack of significant accumulation or distribution.
Conclusion:
Based on the analysis of the technical indicators, the overall outlook for TKLF in the next few days leans towards a sideways movement with a slightly bearish bias. The trend indicators suggest a neutral to bearish trend, while momentum indicators indicate weakness and bearish sentiment. Volatility indicators point towards consolidation and stability, and volume indicators show a balance between buying and selling pressure.
Key Conclusion: Expect TKLF to trade sideways with a potential downside bias in the coming days. It is advisable to closely monitor key support levels and wait for clearer signals before making any trading decisions.