Technical Analysis of TLIS 2024-05-31
Overview:
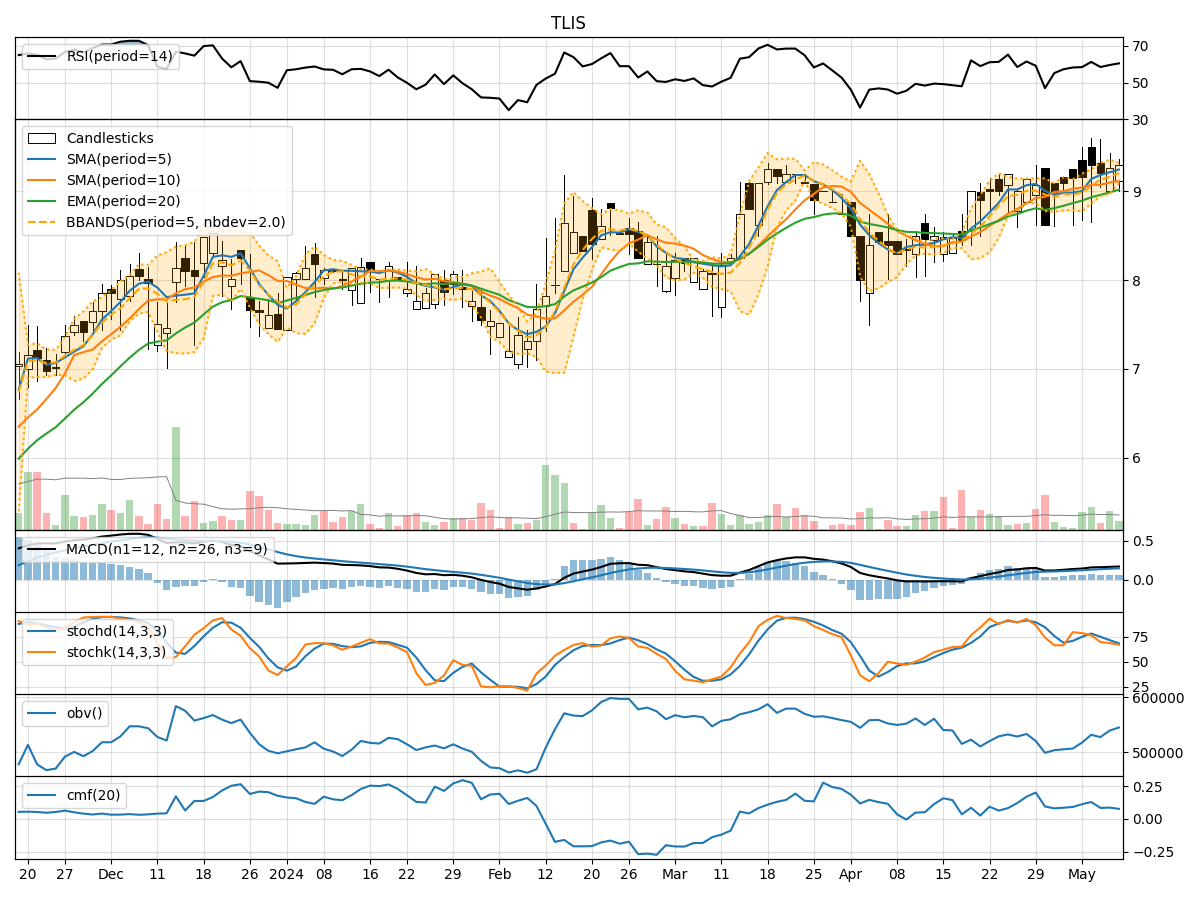
In analyzing the technical indicators for TLIS over the last 5 days, we will delve into the trend, momentum, volatility, and volume indicators to provide a comprehensive outlook on the possible stock price movement in the coming days. By examining these key indicators, we aim to offer valuable insights and predictions for informed decision-making.
Trend Analysis:
- Moving Averages (MA): The 5-day Moving Average (MA) has been showing an upward trend, indicating a positive momentum in the stock price.
- MACD: The Moving Average Convergence Divergence (MACD) has been consistently positive, suggesting a bullish trend in the stock.
- EMA: The Exponential Moving Average (EMA) has been gradually increasing, supporting the bullish sentiment in the stock.
Momentum Analysis:
- RSI: The Relative Strength Index (RSI) has been hovering around the neutral zone, indicating a balanced momentum in the stock.
- Stochastic Oscillator: The Stochastic Oscillator has shown fluctuations but is currently in the overbought territory, signaling a potential reversal in the stock price.
- Williams %R: The Williams %R is also in the oversold region, suggesting a possible correction in the stock price.
Volatility Analysis:
- Bollinger Bands: The Bollinger Bands have been narrowing, indicating decreasing volatility in the stock price.
- Bollinger %B: The %B indicator is currently above 0.5, suggesting a bullish sentiment in the stock.
- Average True Range (ATR): The ATR has been relatively stable, indicating consistent price movements in the stock.
Volume Analysis:
- On-Balance Volume (OBV): The OBV has shown a slight decline, indicating a decrease in buying pressure in the stock.
- Chaikin Money Flow (CMF): The CMF has been negative, suggesting a bearish sentiment in the stock.
Conclusion:
Based on the analysis of the technical indicators, the stock of TLIS is likely to experience sideways consolidation in the coming days. While the trend indicators point towards a bullish sentiment, the momentum indicators suggest a potential reversal or correction. The decreasing volatility and negative volume indicators further support the view of a sideways movement in the stock price. Traders and investors should closely monitor key support and resistance levels for potential entry or exit points in the stock.