Technical Analysis of TMC 2024-05-10
Overview:
In analyzing the technical indicators for TMC over the last 5 days, we will delve into the trend, momentum, volatility, and volume indicators to provide a comprehensive outlook on the possible stock price movement in the coming days. By examining these key aspects, we aim to offer valuable insights and recommendations for potential investors.
Trend Analysis:
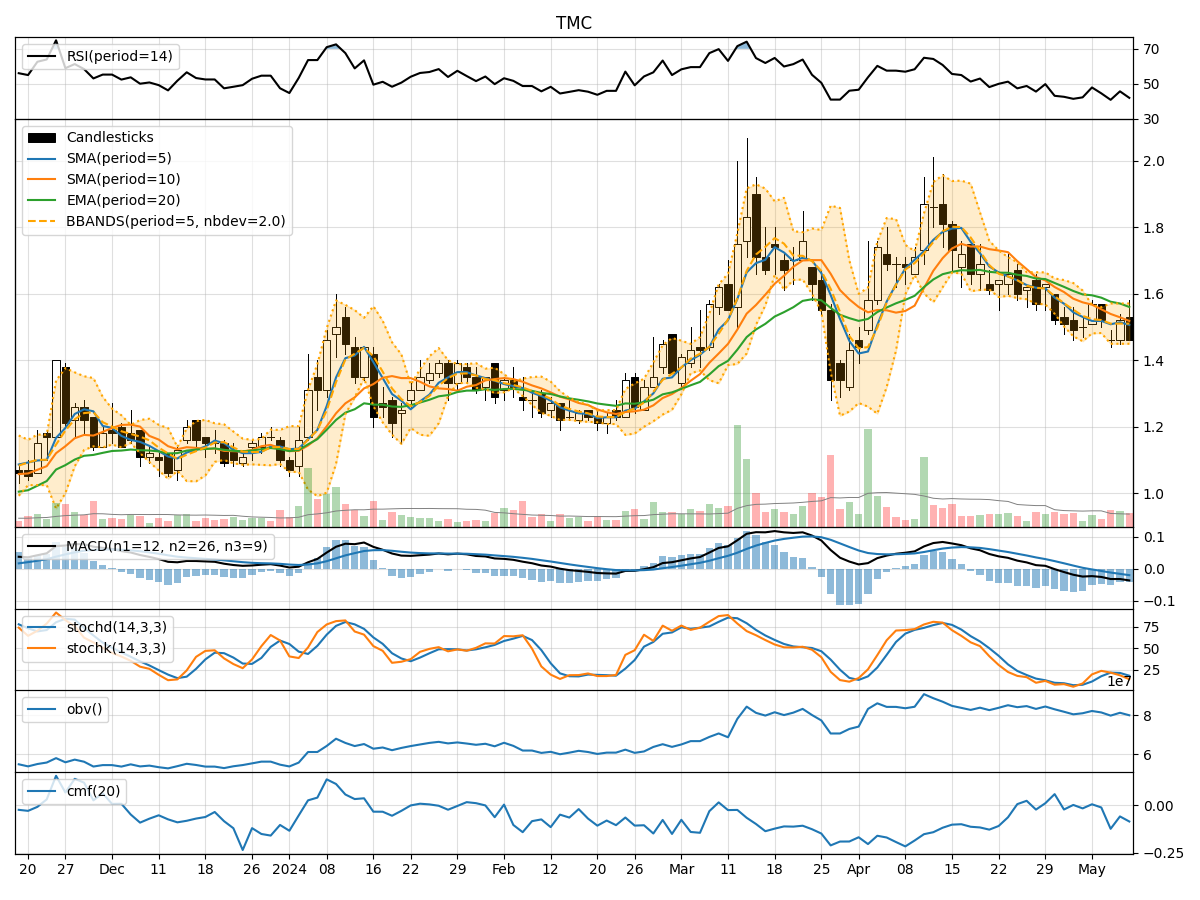
- Moving Averages (MA): The 5-day MA has been consistently below the closing price, indicating a short-term downtrend.
- MACD: The MACD line has been negative for the past 5 days, suggesting a bearish momentum.
Momentum Analysis:
- RSI: The RSI values have been fluctuating around the 40-50 range, indicating a lack of strong momentum in either direction.
- Stochastic Oscillator: Both %K and %D values have been relatively low, reflecting a bearish sentiment.
Volatility Analysis:
- Bollinger Bands (BB): The stock price has been trading within the lower Bollinger Band, suggesting a period of low volatility.
Volume Analysis:
- On-Balance Volume (OBV): The OBV has been declining over the last 5 days, indicating selling pressure.
- Chaikin Money Flow (CMF): The CMF has been negative, signaling a bearish trend in money flow.
Key Observations:
- The stock is currently in a downtrend based on moving averages and MACD.
- Momentum indicators show a lack of strong buying interest.
- Volatility is low, indicating a period of consolidation.
- Volume indicators suggest a bearish sentiment with declining OBV and negative CMF.
Conclusion:
Based on the analysis of the technical indicators, the outlook for TMC in the next few days is bearish. The stock is likely to continue its downward trend, with limited volatility and weak buying interest. Investors should exercise caution and consider waiting for more favorable conditions before considering a long position.