Technical Analysis of TORO 2024-05-10
Overview:
In analyzing the technical indicators for TORO stock over the last 5 days, we will delve into the trend, momentum, volatility, and volume indicators to provide a comprehensive outlook on the possible stock price movement in the coming days. By examining these key indicators, we aim to offer valuable insights and predictions for informed decision-making.
Trend Analysis:
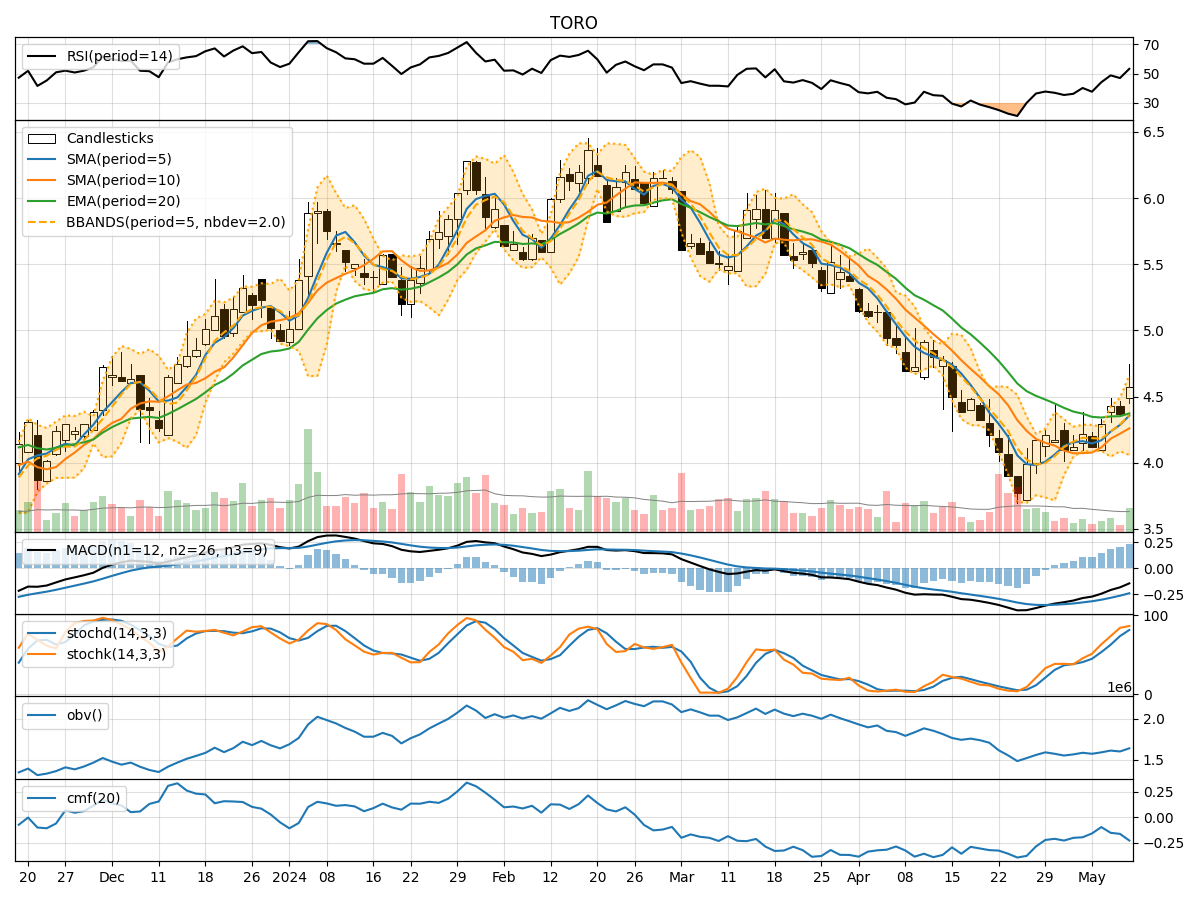
- Moving Averages (MA): The 5-day Moving Average (MA) has been showing an upward trend, indicating a positive momentum in the stock price.
- MACD: The Moving Average Convergence Divergence (MACD) has been consistently negative but showing signs of convergence towards the signal line, suggesting a potential reversal in the trend.
- RSI: The Relative Strength Index (RSI) is hovering around the neutral zone, indicating a balanced momentum in the stock price.
Momentum Analysis:
- Stochastic Oscillator: The Stochastic Oscillator is in the overbought zone, suggesting a potential reversal or consolidation in the stock price.
- Williams %R: The Williams %R is also in the oversold territory, indicating a possible upcoming correction or reversal.
Volatility Analysis:
- Bollinger Bands: The Bollinger Bands are widening, indicating increased volatility in the stock price.
- Volatility Bands: The Volatility Bands are expanding, suggesting potential larger price movements in the near future.
Volume Analysis:
- On-Balance Volume (OBV): The OBV has been declining, indicating a decrease in buying pressure and potential distribution in the stock.
- Chaikin Money Flow (CMF): The CMF is negative, signaling a lack of buying interest and potential weakness in the stock price.
Key Observations:
- The trend indicators suggest a potential reversal or consolidation in the stock price.
- Momentum indicators point towards a possible correction or reversal in the near term.
- Volatility indicators indicate increased price movements and potential fluctuations.
- Volume indicators highlight a decrease in buying pressure and potential weakness in the stock.
Conclusion:
Based on the analysis of the technical indicators, the stock price of TORO is likely to experience sideways movement in the coming days. The indicators suggest a mixed outlook with a potential for consolidation or a minor correction. Traders should exercise caution and closely monitor the price action for any signs of a clear trend direction.