Technical Analysis of TPG 2024-05-10
Overview:
In analyzing the technical indicators for TPG stock over the last 5 days, we will delve into the trend, momentum, volatility, and volume indicators to provide a comprehensive outlook on the possible future stock price movement. By examining these key indicators, we aim to offer valuable insights and predictions for the upcoming trading days.
Trend Indicators:
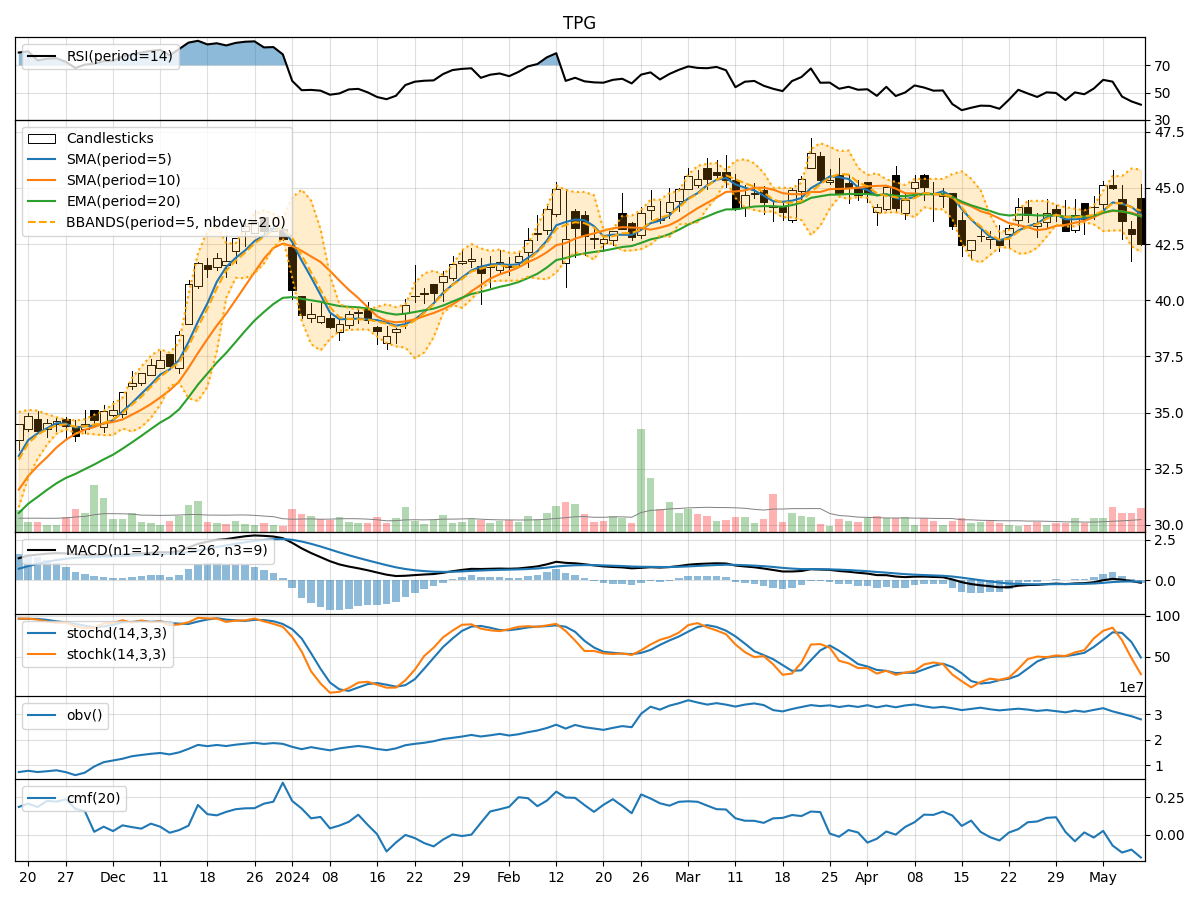
- Moving Averages (MA): The 5-day Moving Average (MA) has been fluctuating around the 43.9 to 44.3 range, indicating a relatively stable trend in the short term.
- MACD: The Moving Average Convergence Divergence (MACD) has shown a slight negative trend, with the MACD line consistently below the signal line over the past 5 days.
- EMA: The Exponential Moving Average (EMA) has been relatively flat, suggesting a lack of strong directional momentum in the stock price.
Momentum Indicators:
- RSI: The Relative Strength Index (RSI) has been gradually decreasing, indicating a weakening momentum in the stock price movement.
- Stochastic Oscillator: Both %K and %D values have been declining, signaling a bearish momentum in the stock.
- Williams %R: The Williams %R indicator has been consistently in the oversold territory, suggesting a potential reversal or bounce in the stock price.
Volatility Indicators:
- Bollinger Bands: The Bollinger Bands have been narrowing, indicating decreasing volatility in the stock price.
- Bollinger %B: The %B value has been hovering around the lower band, suggesting a potential oversold condition in the stock.
- Average True Range (ATR): The ATR has been decreasing, indicating a reduction in price volatility.
Volume Indicators:
- On-Balance Volume (OBV): The OBV has been declining, indicating a potential distribution phase where selling pressure is increasing.
- Chaikin Money Flow (CMF): The CMF has been negative, suggesting that money is flowing out of the stock.
Key Observations and Opinions:
- Trend: The trend indicators show a lack of strong directional bias, with the stock price hovering around the moving averages.
- Momentum: Momentum indicators suggest a bearish sentiment, with decreasing RSI and Stochastic values.
- Volatility: Volatility indicators point towards decreasing volatility, potentially leading to a period of consolidation.
- Volume: Volume indicators indicate a rising selling pressure, as seen in the declining OBV and negative CMF values.
Conclusion:
Based on the analysis of the technical indicators, the next few days for TPG stock are likely to see further downward movement. The bearish momentum, decreasing volatility, and rising selling pressure indicate a potential continuation of the current downtrend. Traders and investors should exercise caution and consider short-term selling strategies or wait for a clear reversal signal before considering long positions.