Technical Analysis of TRIB 2024-05-10
Overview:
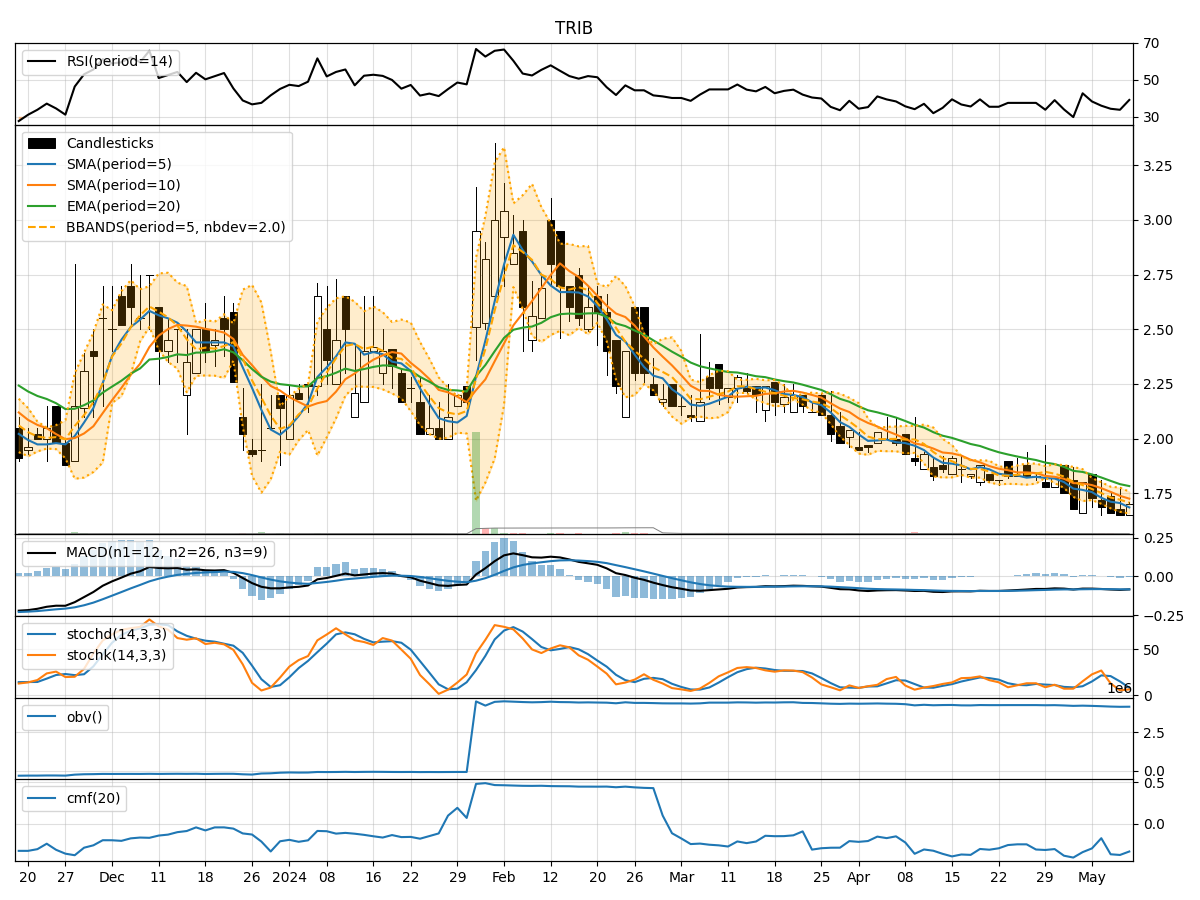
In analyzing the technical indicators for TRIB over the last 5 days, we will delve into the trends, momentum, volatility, and volume aspects to provide a comprehensive outlook on the possible stock price movement in the coming days.
Trend Analysis:
- Moving Averages (MA): The 5-day MA has been consistently below the closing price, indicating a short-term downtrend.
- MACD: The MACD line has been below the signal line, suggesting a bearish momentum.
- EMA: The exponential moving average has been declining, further supporting the bearish trend.
Momentum Analysis:
- RSI: The Relative Strength Index has been hovering around 30-40, indicating a slightly oversold condition.
- Stochastic Oscillator: Both %K and %D have been in the oversold territory, signaling a potential reversal.
- Williams %R: The indicator has been in the oversold region, suggesting a possible buying opportunity.
Volatility Analysis:
- Bollinger Bands: The bands have been narrowing, indicating decreasing volatility.
- Bollinger %B: The %B has been fluctuating within a range, reflecting consolidation.
- Average True Range: The ATR has been decreasing, pointing towards reduced price fluctuations.
Volume Analysis:
- On-Balance Volume (OBV): The OBV has been declining, indicating selling pressure.
- Chaikin Money Flow (CMF): The CMF has been negative, suggesting outflow of money from the stock.
Key Observations:
- The stock is currently in a downtrend based on moving averages and MACD.
- Momentum indicators suggest a potential reversal due to oversold conditions.
- Volatility is decreasing, indicating a period of consolidation.
- Volume indicators show selling pressure and negative money flow.
Conclusion:
Based on the analysis of technical indicators, the next few days for TRIB are likely to see a potential reversal in the downtrend. The oversold conditions in momentum indicators and narrowing volatility suggest a period of consolidation or sideways movement. However, the selling pressure indicated by volume indicators may limit significant upside potential in the short term. Traders should watch for signs of a bullish reversal confirmation before considering long positions.