Technical Analysis of TRIN 2024-05-10
Overview:
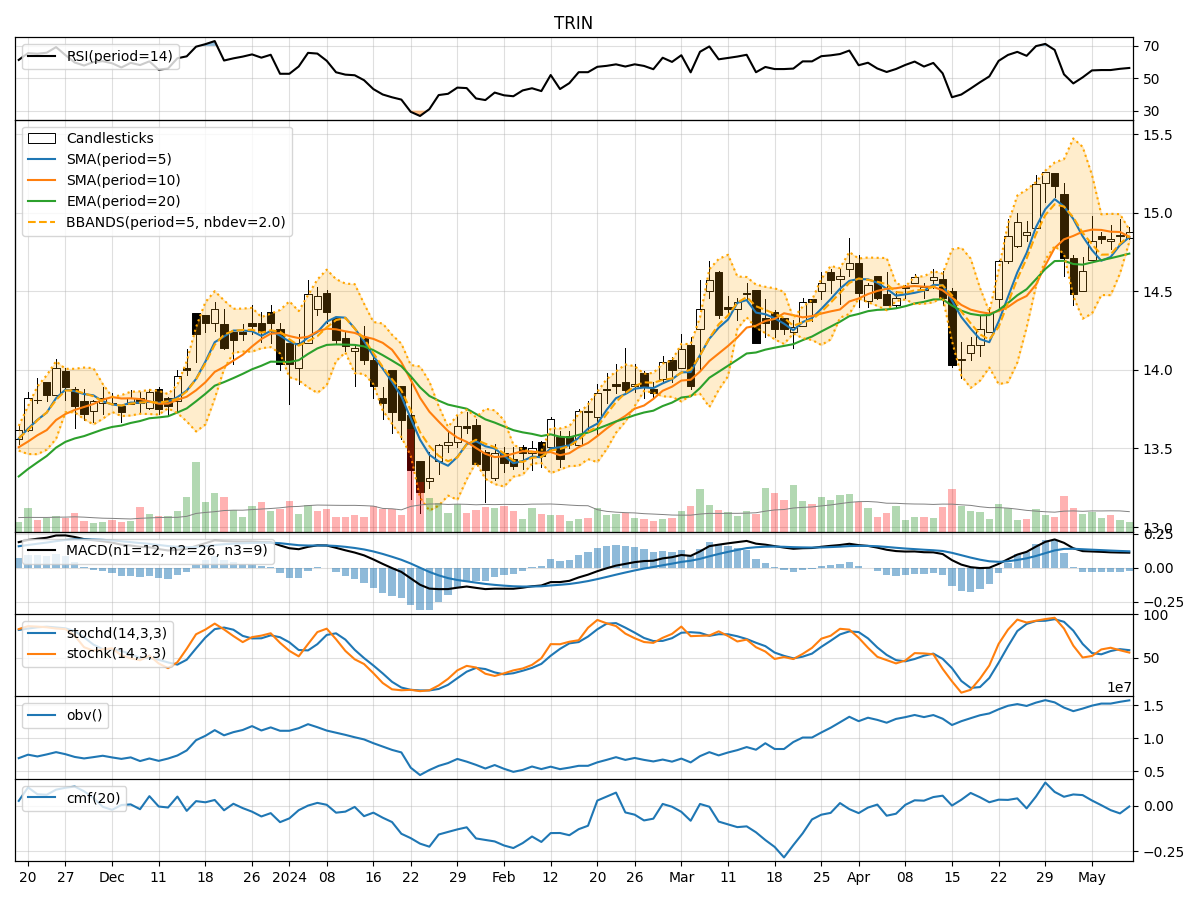
In the last 5 trading days, the stock has shown a relatively stable price movement with slight fluctuations. The trend indicators suggest a neutral to slightly bullish sentiment, while momentum indicators show a mild positive momentum. Volatility indicators indicate a decreasing volatility trend, and volume indicators show mixed signals. Let's delve deeper into each category of indicators to provide a comprehensive analysis and make a prediction for the next few days.
Trend Indicators:
- Moving Averages (MA): The 5-day Moving Average (MA) is slightly above the Simple Moving Average (SMA) and Exponential Moving Average (EMA), indicating a potential bullish trend.
- MACD: The MACD line is positive, and the MACD Histogram is gradually increasing, suggesting a strengthening bullish momentum.
Momentum Indicators:
- RSI: The Relative Strength Index (RSI) is in the neutral zone, indicating neither overbought nor oversold conditions.
- Stochastic Oscillator: Both %K and %D lines are in the neutral zone, suggesting a lack of strong momentum.
- Williams %R: The Williams %R is in the oversold territory, indicating a potential buying opportunity.
Volatility Indicators:
- Bollinger Bands (BB): The Bollinger Bands are narrowing, indicating decreasing volatility and a potential upcoming price breakout.
- Bollinger %B: The %B is close to 1, suggesting the price is near the upper band, potentially indicating an overbought condition.
Volume Indicators:
- On-Balance Volume (OBV): The OBV is showing a slight increase, indicating some accumulation by investors.
- Chaikin Money Flow (CMF): The CMF is negative, suggesting some selling pressure in the market.
Key Observations and Opinions:
- Trend: The trend indicators suggest a slightly bullish sentiment, supported by the positive MACD and MA crossover.
- Momentum: Momentum indicators show a lack of strong momentum, indicating a potential consolidation phase.
- Volatility: Decreasing volatility as indicated by the Bollinger Bands narrowing may precede a significant price movement.
- Volume: Mixed signals from volume indicators suggest indecision among market participants.
Conclusion:
Based on the analysis of technical indicators, the stock is likely to experience sideways consolidation in the next few days. The bullish trend is not strong enough to indicate a significant upward movement, while the lack of strong momentum and mixed volume signals suggest a period of consolidation. Traders should be cautious and wait for a clearer trend confirmation before making significant trading decisions.