Technical Analysis of TRMK 2024-05-10
Overview:
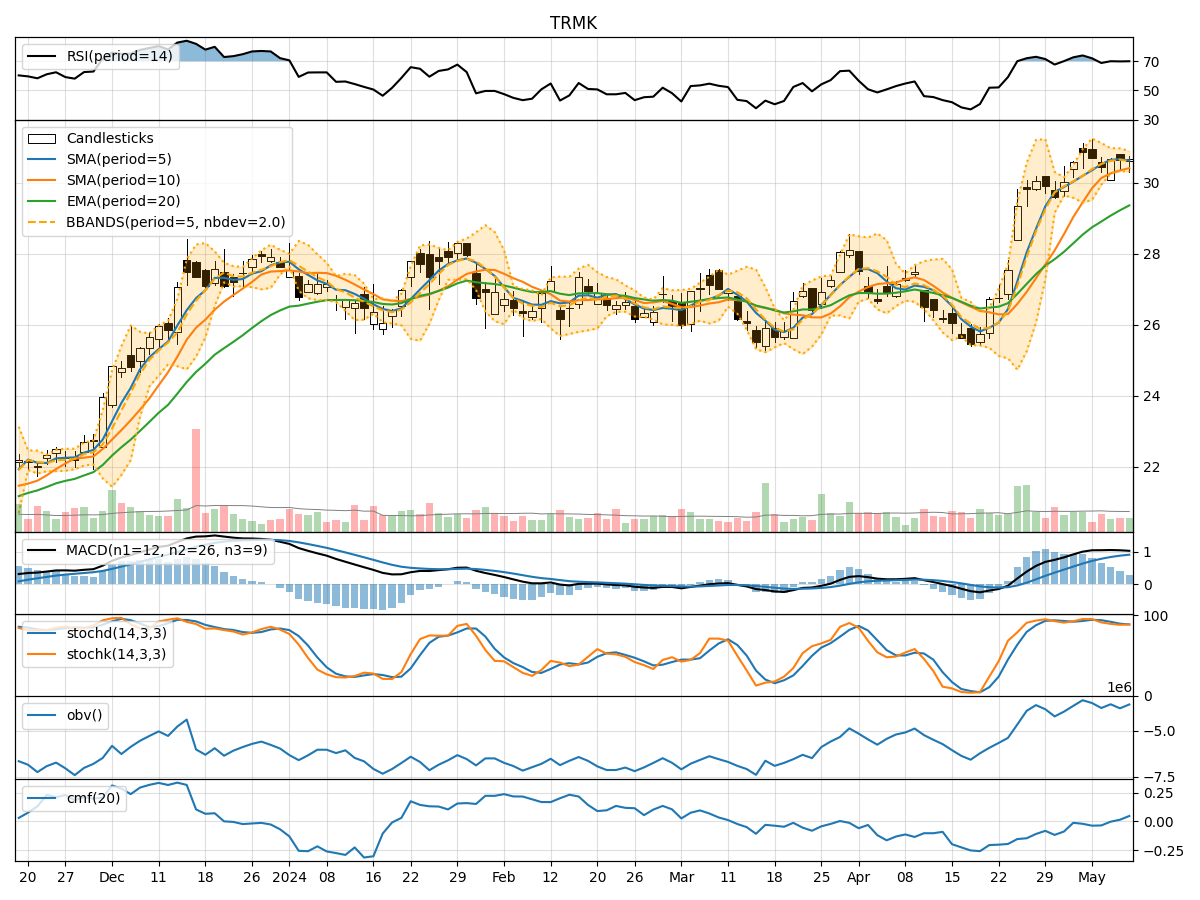
In the last 5 trading days, TRMK stock has shown a relatively stable performance with minor fluctuations in price and volume. By analyzing various technical indicators including trend, momentum, volatility, and volume, we can gain insights into the potential future price movement of TRMK stock.
Trend Analysis:
- Moving Averages (MA): The 5-day Moving Average (MA) has been consistently above the Simple Moving Average (SMA) and Exponential Moving Average (EMA), indicating a short-term bullish trend.
- MACD: The MACD line has been consistently above the signal line, suggesting bullish momentum in the stock price.
Key Observation: The trend indicators suggest a bullish sentiment in the short term.
Momentum Analysis:
- RSI: The Relative Strength Index (RSI) has been hovering around 70, indicating a neutral to slightly overbought condition.
- Stochastic Oscillator: Both %K and %D lines of the Stochastic Oscillator are in the overbought zone, suggesting a potential reversal.
Key Observation: Momentum indicators show a mixed signal with a slight inclination towards a bearish reversal.
Volatility Analysis:
- Bollinger Bands (BB): The stock price has been trading within the Bollinger Bands, with the bands narrowing, indicating decreasing volatility.
Key Observation: Volatility indicators suggest a period of consolidation or a potential breakout.
Volume Analysis:
- On-Balance Volume (OBV): The OBV has shown fluctuations but has not diverged significantly from the price movement, indicating a balanced volume flow.
- Chaikin Money Flow (CMF): The CMF has been negative, suggesting a slight distribution phase.
Key Observation: Volume indicators reflect a neutral stance with no clear accumulation or distribution pattern.
Conclusion:
Based on the analysis of technical indicators: - Trend: The trend indicators point towards an upward movement. - Momentum: The momentum indicators suggest a potential bearish reversal. - Volatility: Volatility indicators indicate a period of consolidation. - Volume: Volume indicators show a neutral volume flow.
Overall Assessment:
Considering the mixed signals from momentum and volume indicators, alongside the bullish trend and consolidation in volatility, the next few days for TRMK stock are likely to see sideways movement with a slight bearish bias. Traders should exercise caution and closely monitor key support and resistance levels for potential entry or exit points.
Remember, market conditions can change rapidly, so it's essential to stay updated with real-time data and adjust your trading strategy accordingly.