Technical Analysis of TRON 2024-05-31
Overview:
In analyzing the technical indicators for TRON over the last 5 days, we will delve into the trend, momentum, volatility, and volume indicators to provide a comprehensive outlook on the possible stock price movement. By examining these key factors, we aim to offer valuable insights and predictions for the upcoming trading days.
Trend Analysis:
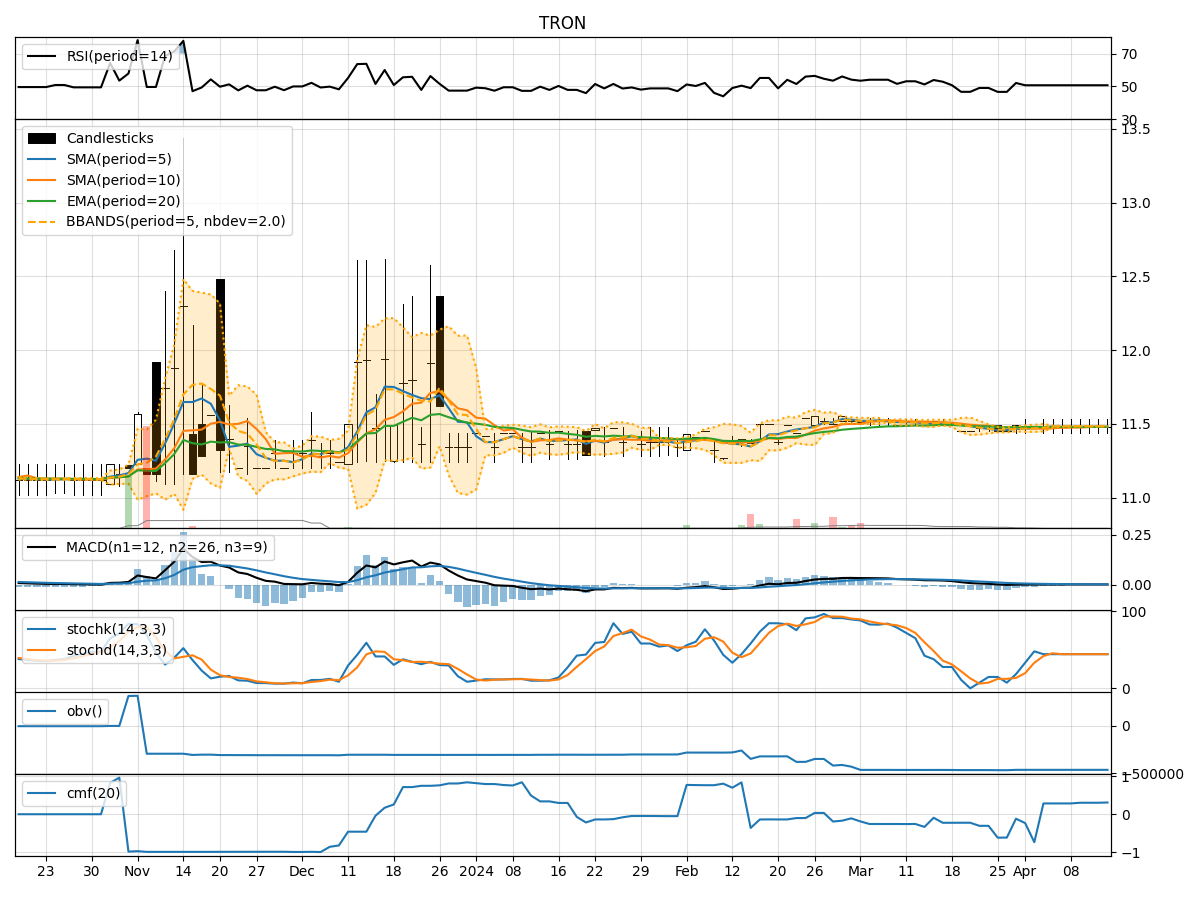
- Moving Averages (MA): The 5-day Moving Average (MA) has been fluctuating around the $11.90 level, indicating a relatively stable trend in the short term.
- MACD: The Moving Average Convergence Divergence (MACD) has shown a slight positive trend, with the MACD line consistently above the signal line, suggesting a potential bullish momentum.
Momentum Analysis:
- RSI: The Relative Strength Index (RSI) has been hovering around the mid-level, indicating a neutral momentum in the stock.
- Stochastic Oscillator: Both %K and %D lines of the Stochastic Oscillator have been gradually increasing, signaling a potential upward momentum.
Volatility Analysis:
- Bollinger Bands (BB): The Bollinger Bands have shown a narrowing of the bands, indicating decreasing volatility in the stock price.
Volume Analysis:
- On-Balance Volume (OBV): The OBV has been relatively stable, suggesting a balance between buying and selling pressure.
- Chaikin Money Flow (CMF): The CMF has been positive, indicating a potential inflow of money into the stock.
Key Observations:
- The trend indicators suggest a neutral to slightly bullish outlook in the short term.
- Momentum indicators show a potential upward momentum building up.
- Volatility has been decreasing, indicating a possible consolidation phase.
- Volume indicators point towards a balanced buying and selling pressure with a positive money flow.
Conclusion:
Based on the analysis of the technical indicators, the next few days for TRON could see a slightly bullish trend with a potential upward momentum. The decreasing volatility and balanced volume suggest a period of consolidation before a possible breakout. Traders may consider monitoring key resistance levels for potential entry points, while keeping an eye on the momentum indicators for confirmation of the bullish trend. Overall, a cautious bullish stance can be adopted for the upcoming trading days.