Technical Analysis of TRVG 2024-05-10
Overview:
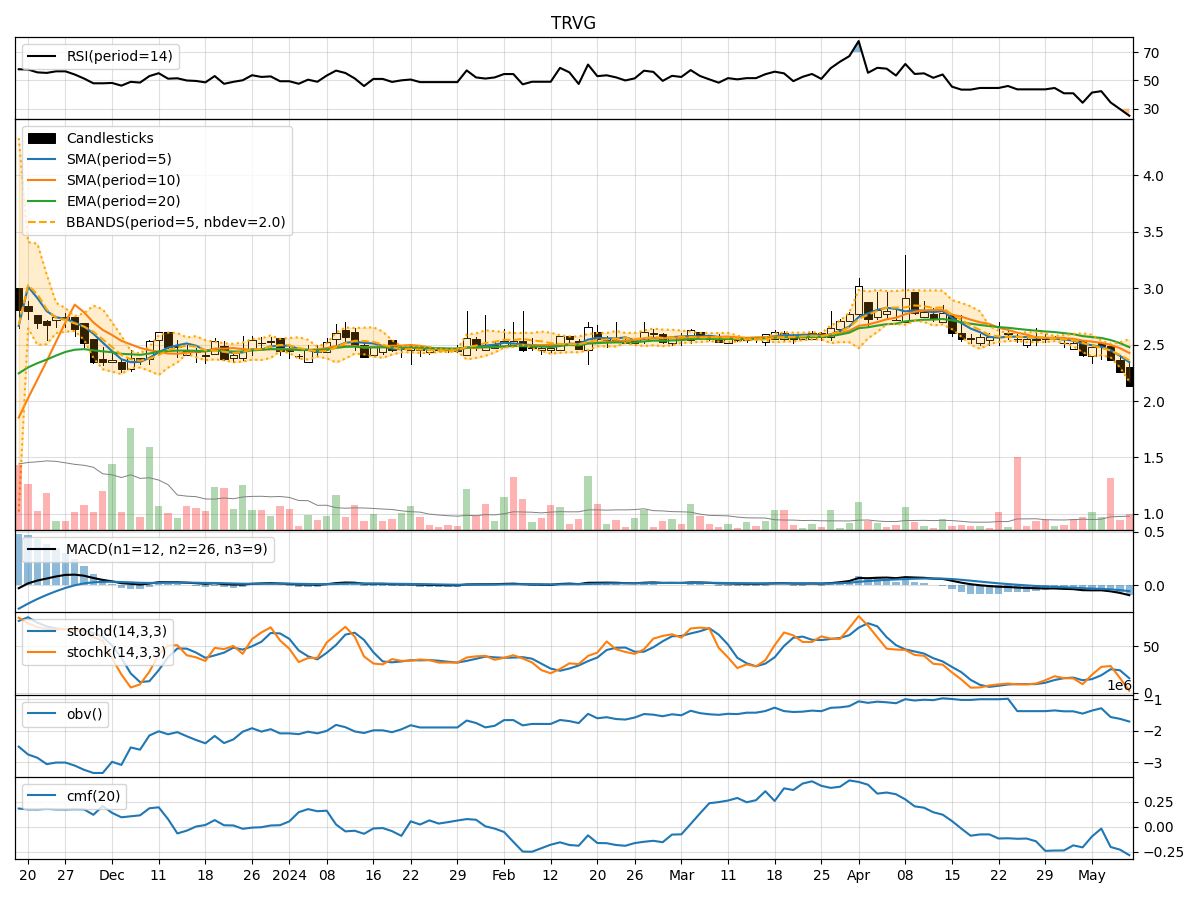
In the last 5 trading days, TRVG stock has shown a downward trend in both price and volume. The moving averages (MA) have been declining, indicating a bearish trend. Momentum indicators like RSI and Stochastic Oscillator are also in oversold territory, suggesting a potential reversal. Volatility has been decreasing, and volume indicators show a decrease in buying pressure.
Trend Analysis:
-
Moving Averages (MA): The 5-day MA has been consistently below the 10-day simple moving average (SMA), indicating a short-term bearish trend. The exponential moving average (EMA) is also declining, further confirming the bearish sentiment.
-
MACD: The MACD line has been below the signal line for the past 5 days, with the MACD histogram showing a decreasing trend. This indicates a bearish momentum in the stock price.
Momentum Analysis:
-
RSI: The Relative Strength Index (RSI) has been decreasing and is currently in the oversold territory below 30. This suggests that the stock may be due for a potential reversal or a period of consolidation.
-
Stochastic Oscillator: Both %K and %D lines of the Stochastic Oscillator are in oversold territory, indicating that the stock is oversold and could potentially see a reversal in the near future.
Volatility Analysis:
- Bollinger Bands (BB): The Bollinger Bands are narrowing, indicating decreasing volatility in the stock price. This could signal a period of consolidation or a potential breakout in the near future.
Volume Analysis:
-
On-Balance Volume (OBV): The OBV has been declining over the past 5 days, indicating that selling pressure has been increasing. This is a bearish sign for the stock.
-
Chaikin Money Flow (CMF): The CMF is negative, suggesting that money is flowing out of the stock. This aligns with the decreasing OBV and indicates a lack of buying interest.
Conclusion:
Based on the technical indicators analyzed, the next few days for TRVG stock are likely to see further downward movement. The trend indicators, momentum indicators, and volume indicators all point towards a bearish outlook. The stock is currently oversold, which could lead to a short-term bounce or consolidation, but the overall trend remains bearish. Traders should exercise caution and consider waiting for more positive signals before considering any long positions.