Technical Analysis of TSEM 2024-05-10
Overview:
In analyzing the technical indicators for TSEM over the last 5 days, we will delve into the trend, momentum, volatility, and volume indicators to provide a comprehensive outlook on the possible stock price movement in the coming days. By examining these key aspects, we aim to offer valuable insights and predictions to guide investment decisions.
Trend Analysis:
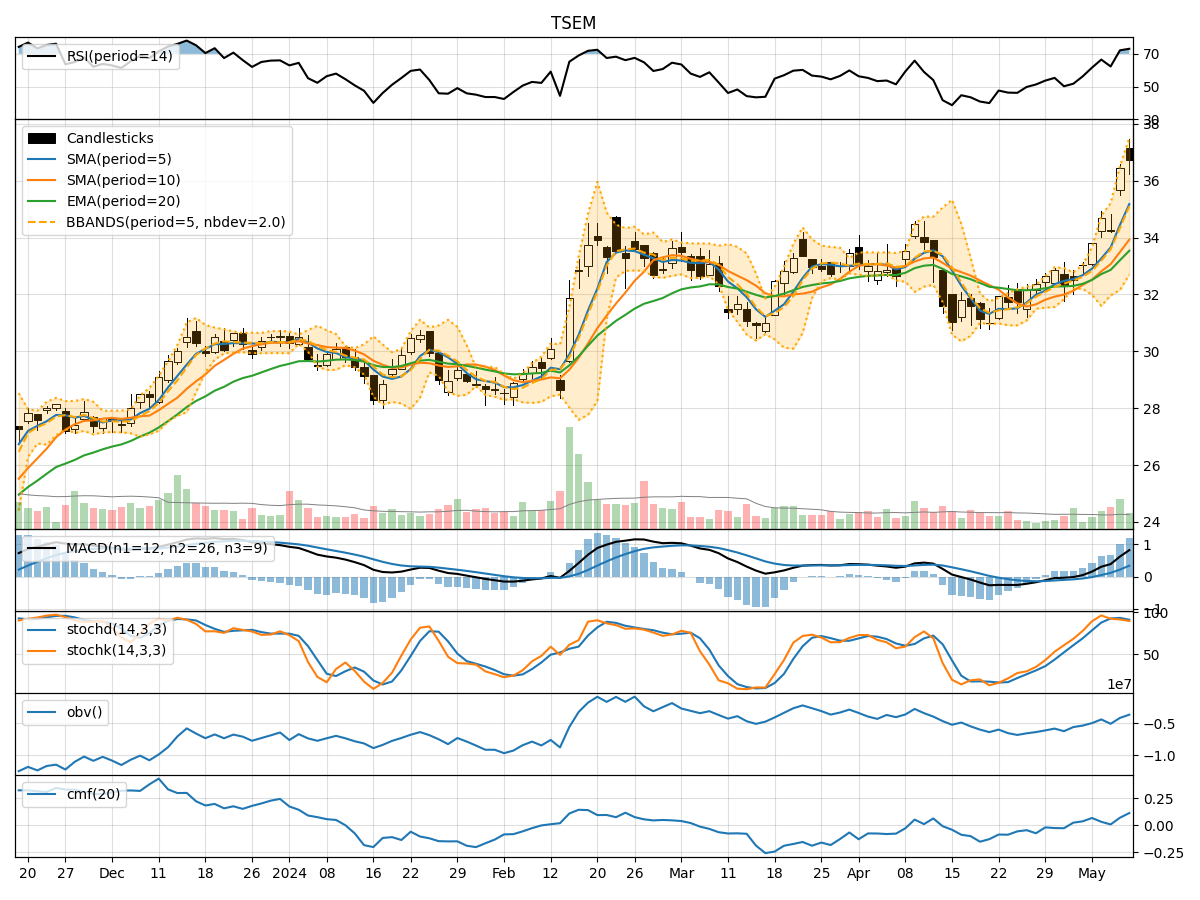
- Moving Averages (MA): The 5-day Moving Average (MA) has been consistently rising, indicating a bullish trend in the short term.
- MACD: The MACD line has been increasing, crossing above the signal line, suggesting a bullish momentum.
- RSI: The Relative Strength Index (RSI) is in the overbought territory, indicating a strong bullish momentum.
Key Observation: The trend indicators suggest a strong bullish sentiment in the stock.
Momentum Analysis:
- Stochastic Oscillator: Both %K and %D lines are in the overbought zone, signaling a potential reversal or consolidation.
- Williams %R: The Williams %R is also in the overbought region, indicating a possible pullback.
Key Observation: Momentum indicators are showing signs of potential overbought conditions, hinting at a temporary pause or reversal in the uptrend.
Volatility Analysis:
- Bollinger Bands (BB): The stock price has been trading near the upper Bollinger Band, indicating high volatility.
- Bollinger %B: The %B value is above 0.8, suggesting the stock is in an overbought condition.
Key Observation: Volatility indicators point towards heightened price fluctuations and a potential reversal due to overbought conditions.
Volume Analysis:
- On-Balance Volume (OBV): The OBV has been increasing, reflecting strong buying pressure.
- Chaikin Money Flow (CMF): The CMF is positive, indicating money flow into the stock.
Key Observation: Volume indicators support the bullish trend with increasing buying pressure and positive money flow.
Conclusion:
Based on the analysis of the technical indicators, the stock of TSEM is currently in a strong bullish trend with overbought conditions in momentum indicators and high volatility. While the trend is positive, the overbought signals suggest a potential short-term correction or consolidation in the stock price. Traders may consider taking profits or waiting for a better entry point, while long-term investors could hold their positions considering the overall bullish sentiment.
Recommendation:
- Short-term Traders: Consider booking profits or waiting for a pullback before entering new positions.
- Long-term Investors: Hold positions with a focus on potential consolidation for accumulation.
Always remember to monitor the indicators regularly for any changes in the market dynamics that could impact your trading or investment strategy.