Technical Analysis of TTWO 2024-05-10
Overview:
In analyzing the technical indicators for TTWO over the last 5 days, we will delve into the trend, momentum, volatility, and volume indicators to provide a comprehensive outlook on the possible stock price movement in the coming days. By examining these key aspects, we aim to offer valuable insights and predictions for informed decision-making.
Trend Analysis:
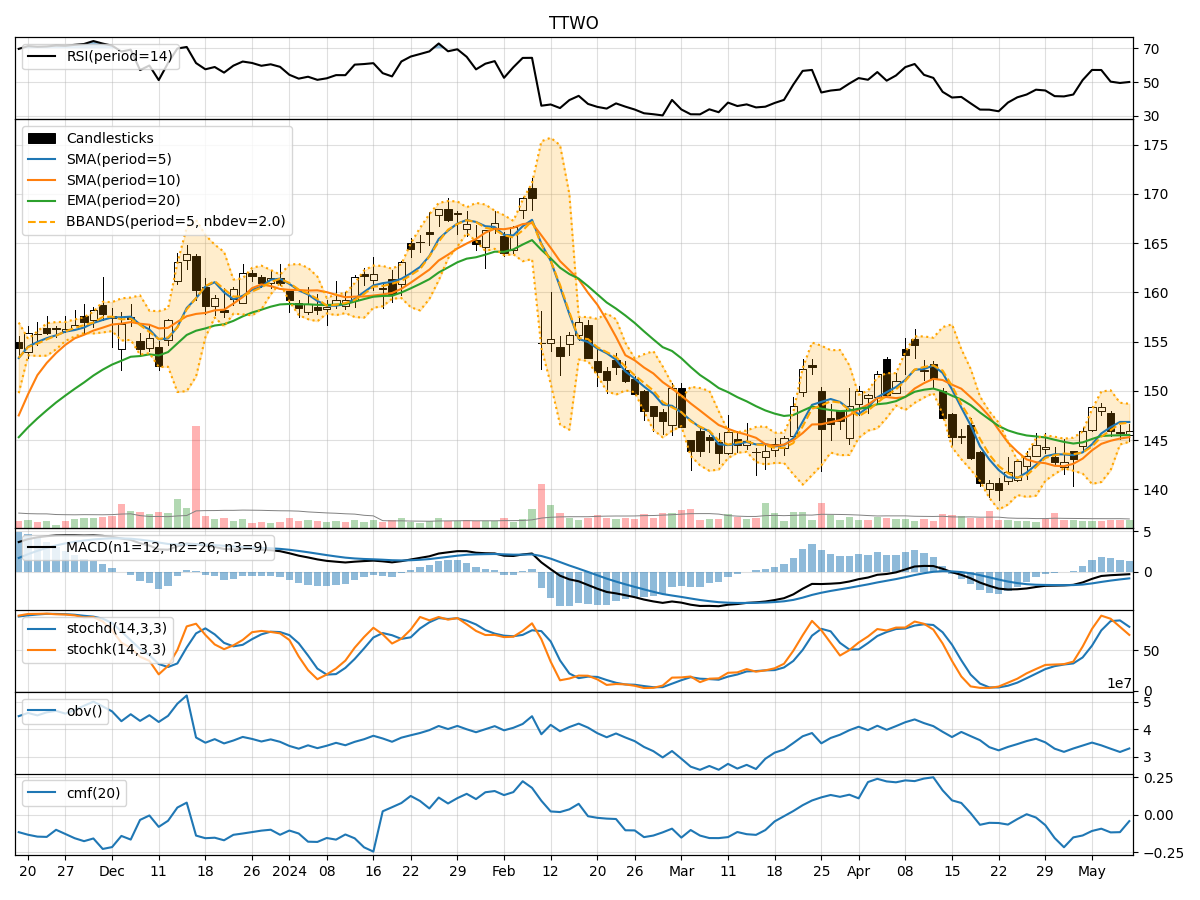
- Moving Averages (MA): The 5-day MA has been consistently above the closing prices, indicating a short-term uptrend.
- MACD: The MACD line has been negative but showing signs of convergence towards the signal line, suggesting a potential reversal.
- RSI: The RSI has been fluctuating around the neutral zone, indicating indecision in the market sentiment.
Momentum Analysis:
- Stochastic Oscillator: The Stochastic indicators have been declining, signaling potential oversold conditions.
- Williams %R (Willr): The Willr values have been consistently in the oversold territory, indicating a possible reversal.
Volatility Analysis:
- Bollinger Bands (BB): The Bollinger Bands have been narrowing, suggesting decreasing volatility and a potential breakout.
- BB %B (bbp): The %B values have been fluctuating within a tight range, indicating consolidation.
Volume Analysis:
- On-Balance Volume (OBV): The OBV has been declining, suggesting selling pressure in the market.
- Chaikin Money Flow (CMF): The CMF has been negative, indicating outflow of money from the stock.
Key Observations:
- The trend indicators show a mixed signal with a potential reversal in the MACD.
- Momentum indicators point towards oversold conditions, indicating a possible buying opportunity.
- Volatility is decreasing, hinting at a potential breakout or consolidation phase.
- Volume indicators suggest selling pressure and a negative money flow.
Conclusion:
Based on the analysis of the technical indicators, the stock price of TTWO is likely to experience further downside movement in the coming days. The trend indicators show signs of a potential reversal, while momentum indicators indicate oversold conditions. Volatility is decreasing, suggesting a possible consolidation phase, and volume indicators point towards selling pressure. Therefore, investors should exercise caution and consider waiting for more clarity in the market before making any significant trading decisions.