Technical Analysis of TW 2024-05-10
Overview:
In analyzing the technical indicators for TW over the last 5 days, we will delve into the trend, momentum, volatility, and volume indicators to provide a comprehensive outlook on the possible stock price movement in the coming days.
Trend Analysis:
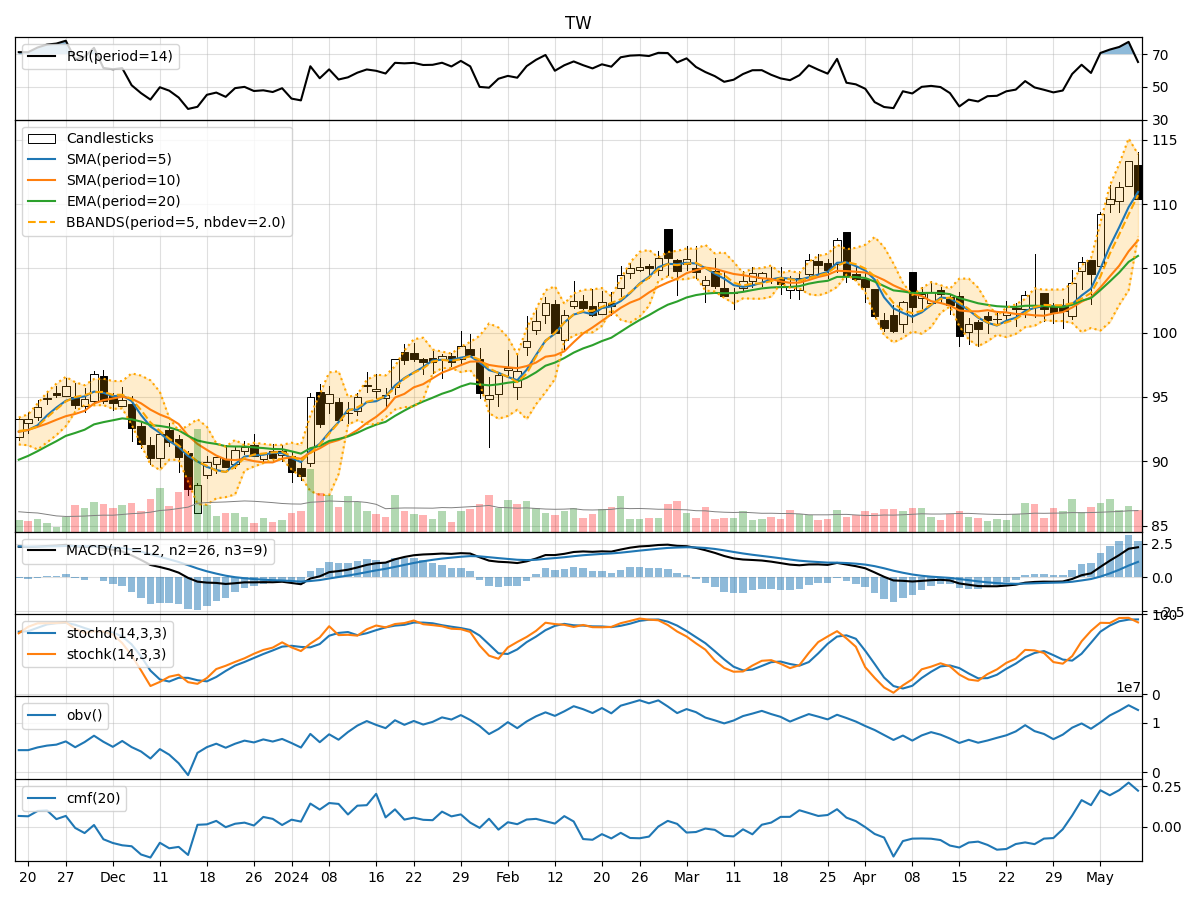
- Moving Averages (MA): The 5-day Moving Average has been consistently rising, indicating a bullish trend.
- MACD: The MACD line has been above the signal line, suggesting bullish momentum.
- EMA: The Exponential Moving Average has been trending upwards, supporting a bullish outlook.
Momentum Analysis:
- RSI: The Relative Strength Index has been in the overbought territory, indicating strong buying momentum.
- Stochastic Oscillator: Both %K and %D have been in the overbought zone, signaling a potential reversal.
- Williams %R: The indicator has been in the oversold region, suggesting a possible upward movement.
Volatility Analysis:
- Bollinger Bands: The stock price has been trading within the bands, indicating normal volatility.
- Bollinger %B: The %B indicator has been fluctuating around the midline, suggesting a balanced market sentiment.
Volume Analysis:
- On-Balance Volume (OBV): The OBV has shown mixed signals, with some days seeing accumulation and others distribution.
- Chaikin Money Flow (CMF): The CMF has been positive, indicating buying pressure in the stock.
Key Observations:
- The trend indicators point towards a bullish sentiment, supported by rising moving averages and MACD.
- Momentum indicators suggest a potential reversal in the overbought zone, especially with the Stochastic Oscillator.
- Volatility remains relatively stable, with the stock price trading within the Bollinger Bands.
- Volume indicators show mixed signals, with OBV fluctuating and CMF indicating buying pressure.
Conclusion:
Based on the analysis of the technical indicators, the stock price of TW is likely to experience further upward movement in the coming days. The bullish trend supported by moving averages and MACD, along with positive momentum indicators, indicates a potential continuation of the uptrend. While some caution is warranted due to overbought conditions in momentum indicators, the overall outlook remains bullish. Traders and investors may consider buying opportunities in TW based on the current technical analysis.