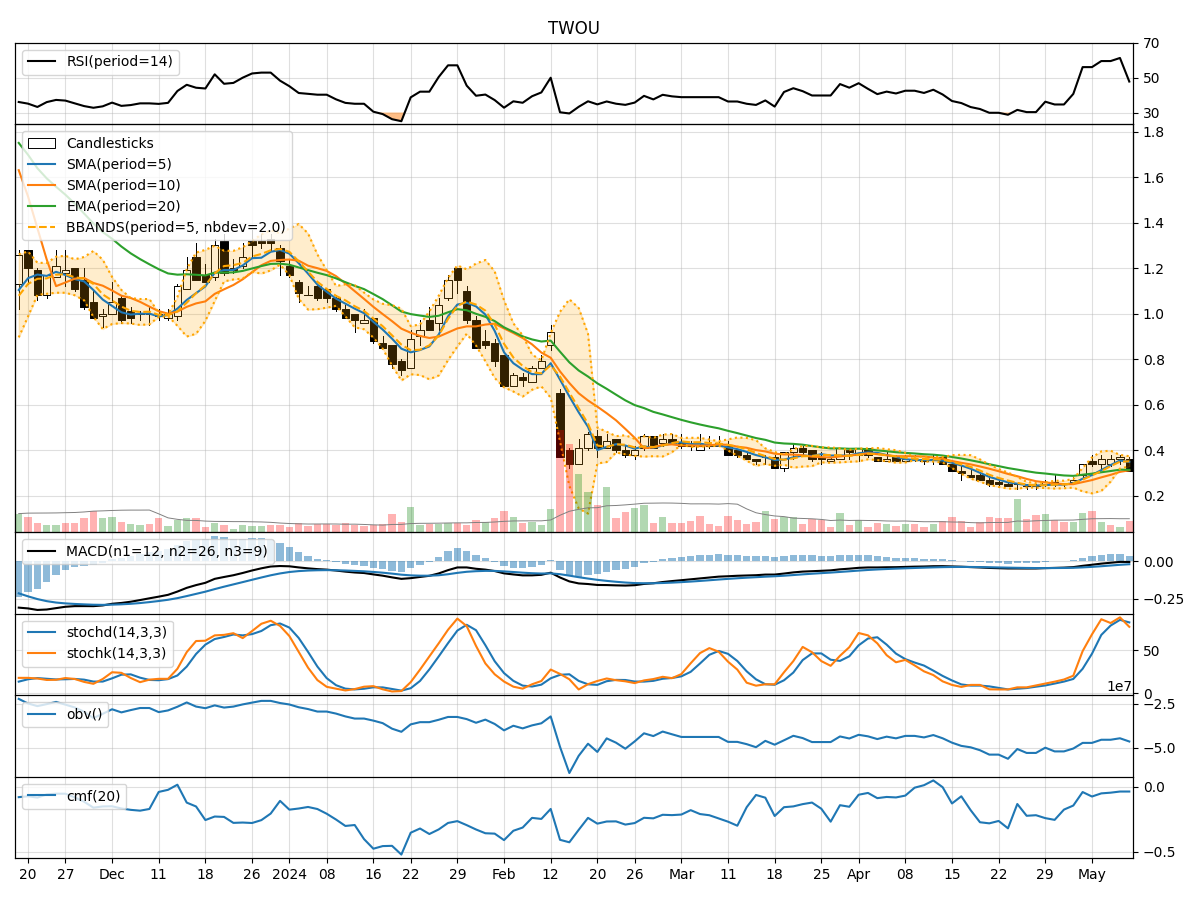
Technical Analysis of TWOU 2024-05-10
Overview:
In analyzing the technical indicators for TWOU over the last 5 days, we will delve into the trend, momentum, volatility, and volume indicators to provide a comprehensive outlook on the possible stock price movement in the coming days. By examining these key indicators, we aim to offer valuable insights and predictions for informed decision-making.
Trend Analysis:
- Moving Averages (MA): The 5-day MA has been consistently above the closing prices, indicating a bullish trend.
- MACD: The MACD line has been negative but showing signs of convergence with the signal line, suggesting a potential trend reversal.
- EMA: The EMA has been gradually increasing, reflecting a positive trend momentum.
Momentum Analysis:
- RSI: The RSI has been fluctuating within the neutral zone, indicating indecision in the market.
- Stochastic Oscillator: Both %K and %D have been in overbought territory, signaling a potential reversal.
- Williams %R: The indicator has been in oversold territory, suggesting a possible buying opportunity.
Volatility Analysis:
- Bollinger Bands: The bands have been narrowing, indicating decreasing volatility and a potential breakout.
- Bollinger %B: The %B has been fluctuating around the midline, reflecting uncertainty in price direction.
Volume Analysis:
- On-Balance Volume (OBV): The OBV has been declining, suggesting selling pressure in the market.
- Chaikin Money Flow (CMF): The CMF has been negative, indicating outflow of money from the stock.
Key Observations:
- The trend indicators suggest a bullish bias, supported by the moving averages and EMA.
- Momentum indicators show mixed signals with RSI in a neutral zone and stochastic oscillators indicating potential reversals.
- Volatility indicators point towards decreasing volatility and a possible breakout.
- Volume indicators reflect selling pressure and negative money flow.
Conclusion:
Based on the analysis of the technical indicators, the stock price of TWOU is likely to experience further consolidation in the coming days. The bullish trend indicated by moving averages and EMA may face resistance due to mixed signals from momentum indicators and selling pressure reflected in volume indicators. The decreasing volatility suggests a potential breakout, but the overall market sentiment remains uncertain. Therefore, it is advisable to exercise caution and closely monitor key levels for potential entry or exit points.
Recommendation:
- Short-term traders: Consider waiting for clearer signals or confirmation of a trend reversal before taking positions.
- Long-term investors: Monitor the stock closely and consider potential entry points during price dips or consolidation phases.
- Risk management: Implement stop-loss orders to protect capital in case of unexpected price movements.
In conclusion, while the technical indicators provide valuable insights, it is essential to consider other fundamental factors and market dynamics before making investment decisions. Conducting thorough research and consulting with a financial advisor can further enhance decision-making processes.