Technical Analysis of TXRH 2024-05-10
Overview:
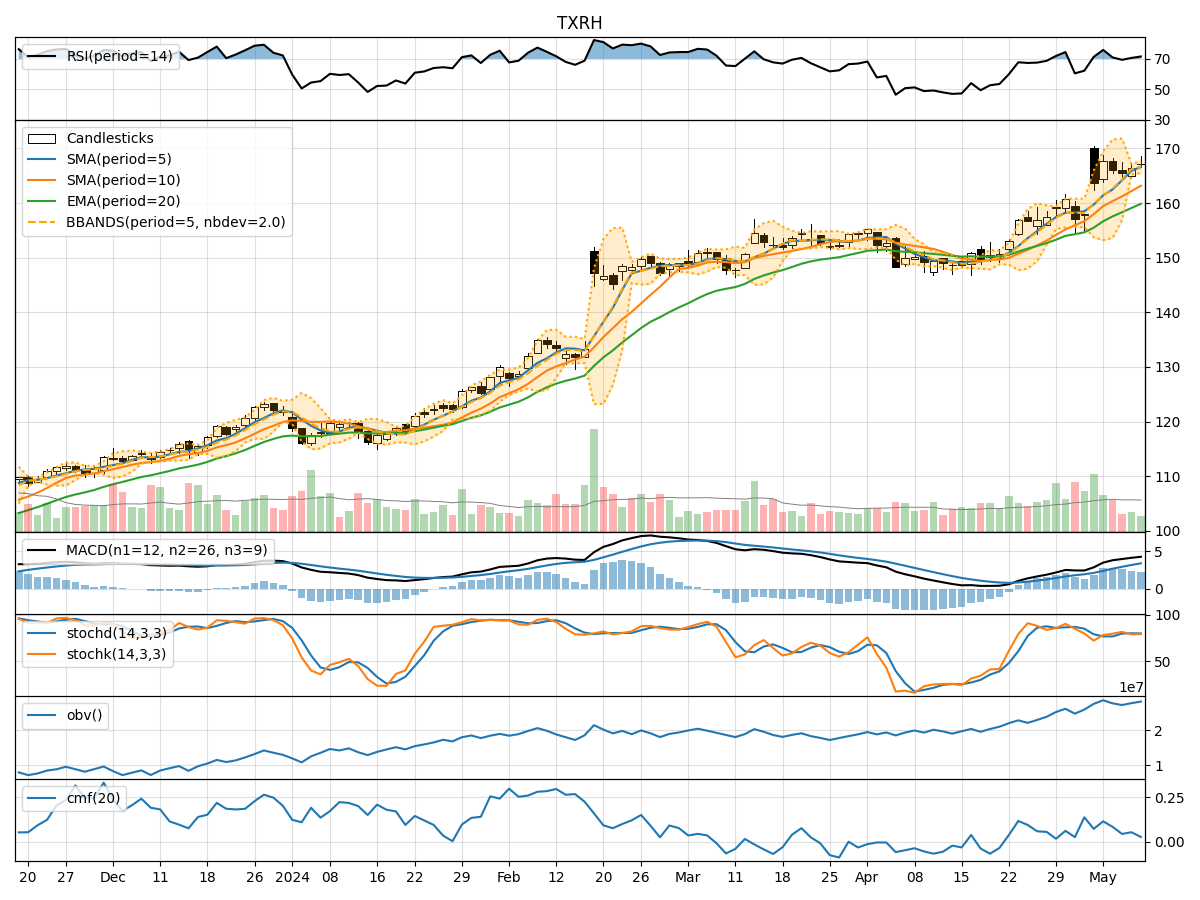
In analyzing the technical indicators for TXRH over the last 5 days, we will delve into the trend, momentum, volatility, and volume indicators to provide a comprehensive outlook on the possible stock price movement in the coming days. By examining these key aspects, we aim to offer valuable insights and predictions for potential investors.
Trend Indicators:
- Moving Averages (MA): The moving averages have been showing an upward trend, with the 5-day MA consistently above the longer-term SMAs and EMAs. This indicates a bullish momentum in the short term.
- MACD: The MACD line has been consistently above the signal line, suggesting a positive trend in price momentum.
- MACD Histogram: The MACD histogram has been increasing, indicating strengthening bullish momentum.
Momentum Indicators:
- RSI: The RSI has been in the overbought territory, indicating a strong bullish momentum in the stock.
- Stochastic Oscillator: Both %K and %D lines of the stochastic oscillator have been in the overbought zone, signaling a potential reversal or consolidation.
- Williams %R: The Williams %R has been consistently in the oversold region, suggesting a strong bullish sentiment.
Volatility Indicators:
- Bollinger Bands: The Bollinger Bands have been narrowing, indicating decreasing volatility in the stock price.
- Bollinger %B: The %B indicator has been hovering around 0.5, suggesting a neutral stance in terms of volatility.
Volume Indicators:
- On-Balance Volume (OBV): The OBV has been showing a slight increase, indicating a positive accumulation of the stock.
- Chaikin Money Flow (CMF): The CMF has been positive but decreasing, suggesting a potential weakening of buying pressure.
Conclusion:
Based on the analysis of the technical indicators, the stock of TXRH is currently exhibiting strong bullish momentum in the short term, supported by the moving averages, MACD, RSI, and stochastic oscillator. However, the overbought conditions in the RSI and stochastic oscillator signal a potential reversal or consolidation in the near future. The narrowing Bollinger Bands indicate decreasing volatility, while the OBV shows positive accumulation.
Recommendation:
Considering the overall bullish sentiment but the overbought conditions in some indicators, investors should exercise caution. It is advisable to monitor the stock closely for signs of a potential reversal or consolidation. Traders may consider taking profits or implementing risk management strategies to protect gains. Long-term investors can use any potential pullback as a buying opportunity, considering the positive trend in the moving averages and MACD.
Key Takeaways:
- Bullish Momentum: Strong bullish momentum indicated by moving averages, MACD, and RSI.
- Overbought Conditions: RSI and stochastic oscillator in overbought territory, signaling caution.
- Decreasing Volatility: Narrowing Bollinger Bands suggest decreasing volatility.
- Accumulation: Positive OBV indicates accumulation despite potential reversal signals.
In conclusion, while the stock of TXRH shows signs of continued bullish momentum, investors should remain vigilant for any signs of a reversal or consolidation in the near term. It is essential to combine technical analysis with risk management strategies to make informed investment decisions.