Technical Analysis of UCAR 2024-05-10
Overview:
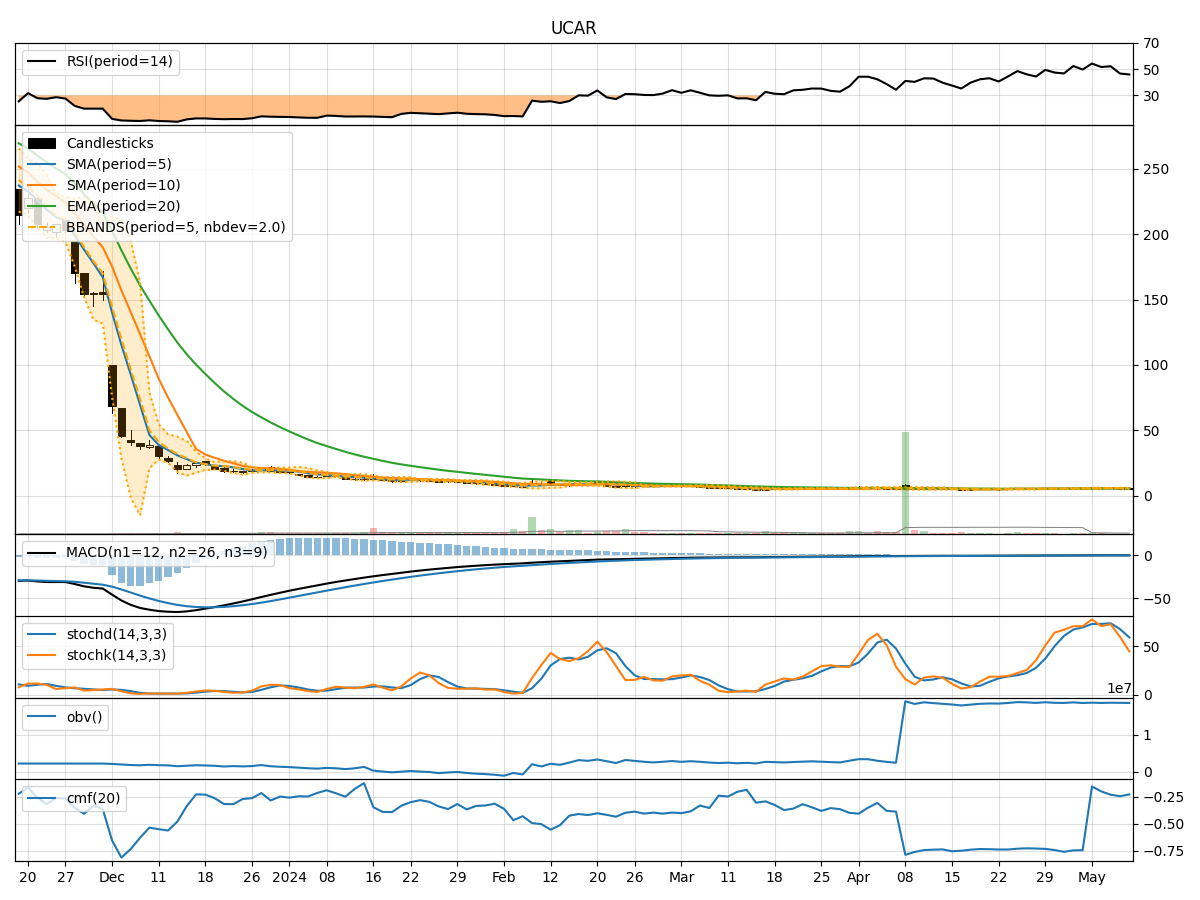
In analyzing the technical indicators for UCAR over the last 5 days, we will delve into the trend, momentum, volatility, and volume indicators to provide a comprehensive outlook on the possible stock price movement in the coming days. By examining these key aspects, we aim to offer valuable insights and recommendations for potential investors.
Trend Analysis:
- Moving Averages (MA): The 5-day Moving Average (MA) has been fluctuating around the closing prices, indicating short-term price trends. The Simple Moving Average (SMA) and Exponential Moving Average (EMA) show a slight uptrend, suggesting a potential bullish sentiment.
- MACD: The Moving Average Convergence Divergence (MACD) has been negative but converging towards the signal line, indicating a possible trend reversal.
- Conclusion: The trend indicators suggest a potential bullish reversal in the stock price.
Momentum Analysis:
- RSI: The Relative Strength Index (RSI) has been fluctuating around the neutral zone, indicating indecision in the market sentiment.
- Stochastic Oscillator: Both %K and %D have been declining, showing a bearish momentum.
- Conclusion: The momentum indicators suggest a bearish sentiment in the stock price.
Volatility Analysis:
- Bollinger Bands (BB): The stock price has been trading within the Bollinger Bands, with the bands narrowing, indicating reduced volatility.
- Conclusion: The volatility indicators suggest a consolidation phase in the stock price.
Volume Analysis:
- On-Balance Volume (OBV): The OBV has been relatively stable, indicating a balance between buying and selling pressure.
- Chaikin Money Flow (CMF): The CMF has been negative, suggesting a slight outflow of money from the stock.
- Conclusion: The volume indicators suggest a neutral stance in the stock price.
Conclusion:
Based on the analysis of trend, momentum, volatility, and volume indicators, the overall outlook for UCAR in the next few days is as follows: - Trend: Upward trend with a potential bullish reversal. - Momentum: Bearish sentiment indicating a downward pressure. - Volatility: Consolidation phase with reduced volatility. - Volume: Neutral stance with a balance between buying and selling pressure.
Recommendation:
Considering the mixed signals from the technical indicators, it is advisable for investors to exercise caution and closely monitor the stock price movement. Traders may consider waiting for more clarity in the market sentiment before making significant investment decisions. It is essential to incorporate fundamental analysis and market news to validate the technical analysis findings for a well-rounded investment strategy.