Technical Analysis of UDMY 2024-05-10
Overview:
In analyzing the technical indicators for UDMY stock over the last 5 days, we will delve into the trend, momentum, volatility, and volume indicators to provide a comprehensive outlook on the possible stock price movement in the coming days. By examining these key indicators, we aim to offer valuable insights and predictions for potential investors.
Trend Analysis:
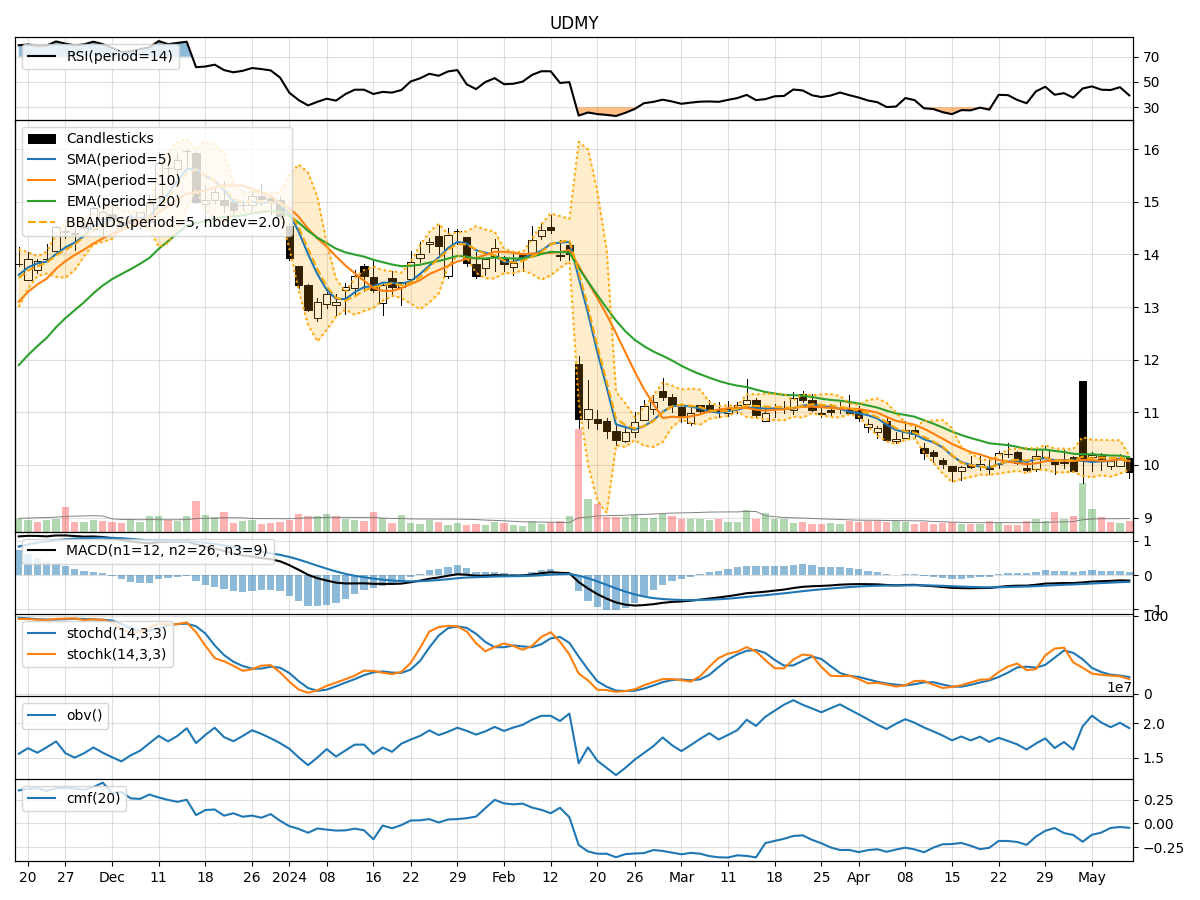
- Moving Averages (MA): The 5-day Moving Average (MA) has been fluctuating around the current stock price, indicating a lack of clear trend direction.
- MACD: The Moving Average Convergence Divergence (MACD) has been negative, suggesting a bearish momentum in the short term.
- EMA: The Exponential Moving Average (EMA) has been declining, further supporting the bearish sentiment in the stock.
Momentum Analysis:
- RSI: The Relative Strength Index (RSI) has been hovering around the neutral zone, indicating a lack of strong momentum either bullish or bearish.
- Stochastic Oscillator: Both %K and %D of the Stochastic Oscillator have been decreasing, signaling a bearish momentum.
- Williams %R: The Williams %R is in the oversold territory, suggesting a potential reversal or bounce in the stock price.
Volatility Analysis:
- Bollinger Bands: The Bollinger Bands have been narrowing, indicating decreasing volatility in the stock.
- Bollinger %B: The %B indicator is close to the lower band, suggesting a possible oversold condition in the stock.
Volume Analysis:
- On-Balance Volume (OBV): The OBV has been fluctuating, indicating indecision among investors regarding the stock.
- Chaikin Money Flow (CMF): The CMF has been negative, reflecting selling pressure in the stock.
Key Observations and Opinions:
- Trend: The trend indicators suggest a bearish sentiment in the stock, with the MACD and EMA pointing towards a potential downward movement.
- Momentum: The momentum indicators also support a bearish view, with the Stochastic Oscillator and Williams %R signaling oversold conditions.
- Volatility: Decreasing volatility as indicated by the Bollinger Bands may lead to a period of consolidation or a potential breakout.
- Volume: The volume indicators show mixed signals, with OBV fluctuating and CMF indicating selling pressure.
Conclusion:
Based on the analysis of the technical indicators, the outlook for UDMY stock in the next few days is bearish. The trend, momentum, and volume indicators all point towards a potential downward movement in the stock price. Traders and investors should exercise caution and consider waiting for a clearer signal or confirmation before making any trading decisions.