Technical Analysis of UROY 2024-05-10
Overview:
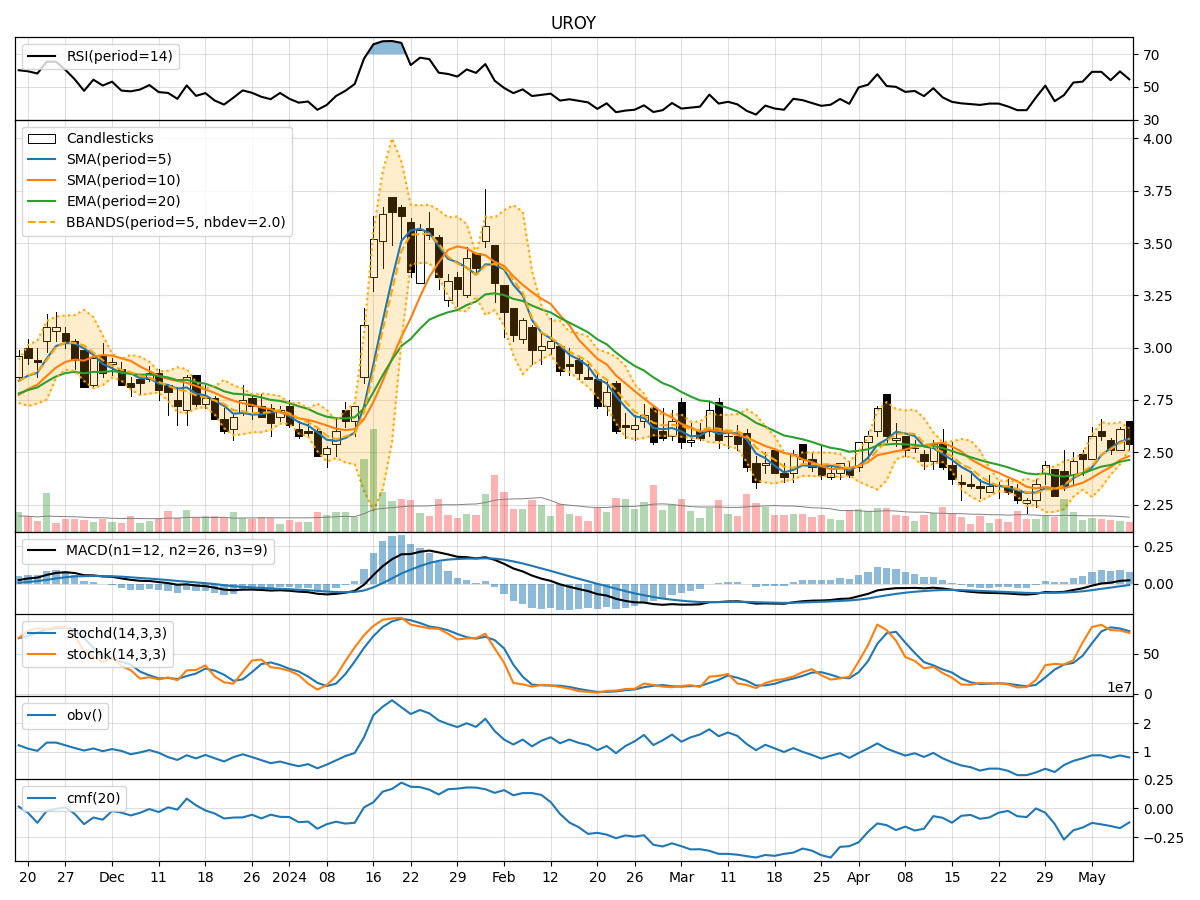
In analyzing the technical indicators for UROY over the last 5 days, we will delve into the trend, momentum, volatility, and volume indicators to provide a comprehensive outlook on the possible stock price movement in the coming days. By examining these key aspects, we aim to offer valuable insights and recommendations for potential investors.
Trend Indicators:
- Moving Averages (MA): The 5-day moving average has been consistently above the closing prices, indicating a short-term uptrend.
- MACD: The MACD line has been positive and increasing, suggesting bullish momentum.
- MACD Histogram: The histogram has been above the zero line, indicating bullish momentum is strengthening.
Momentum Indicators:
- RSI: The RSI has been fluctuating around the 50 level, indicating a neutral momentum.
- Stochastic Oscillator: Both %K and %D have been declining, signaling a potential reversal in momentum.
- Williams %R: The indicator has been in oversold territory, suggesting a possible upcoming bounce.
Volatility Indicators:
- Bollinger Bands: The bands have been narrowing, indicating decreasing volatility.
- Bollinger %B: The %B has been decreasing, suggesting a potential consolidation phase.
- Average True Range (ATR): ATR has been decreasing, indicating lower volatility in the stock.
Volume Indicators:
- On-Balance Volume (OBV): The OBV has been fluctuating, indicating indecision among market participants.
- Chaikin Money Flow (CMF): The CMF has been negative, suggesting selling pressure in the stock.
Key Observations:
- The trend indicators point towards a bullish sentiment with moving averages and MACD signaling upward momentum.
- Momentum indicators show a mixed picture with RSI neutral, stochastic oscillator indicating a potential reversal, and Williams %R in oversold territory.
- Volatility indicators suggest decreasing volatility and a possible consolidation phase.
- Volume indicators reflect indecision among market participants with OBV fluctuating and CMF indicating selling pressure.
Conclusion:
Based on the analysis of the technical indicators, the next few days for UROY could see sideways movement with a slight bullish bias. The stock may consolidate within a range as volatility decreases, but the overall trend remains positive. Investors should monitor key levels such as support and resistance to gauge potential breakout or breakdown scenarios. It is advisable to wait for further confirmation from price action before making significant trading decisions.