Technical Analysis of USGO 2024-05-10
Overview:
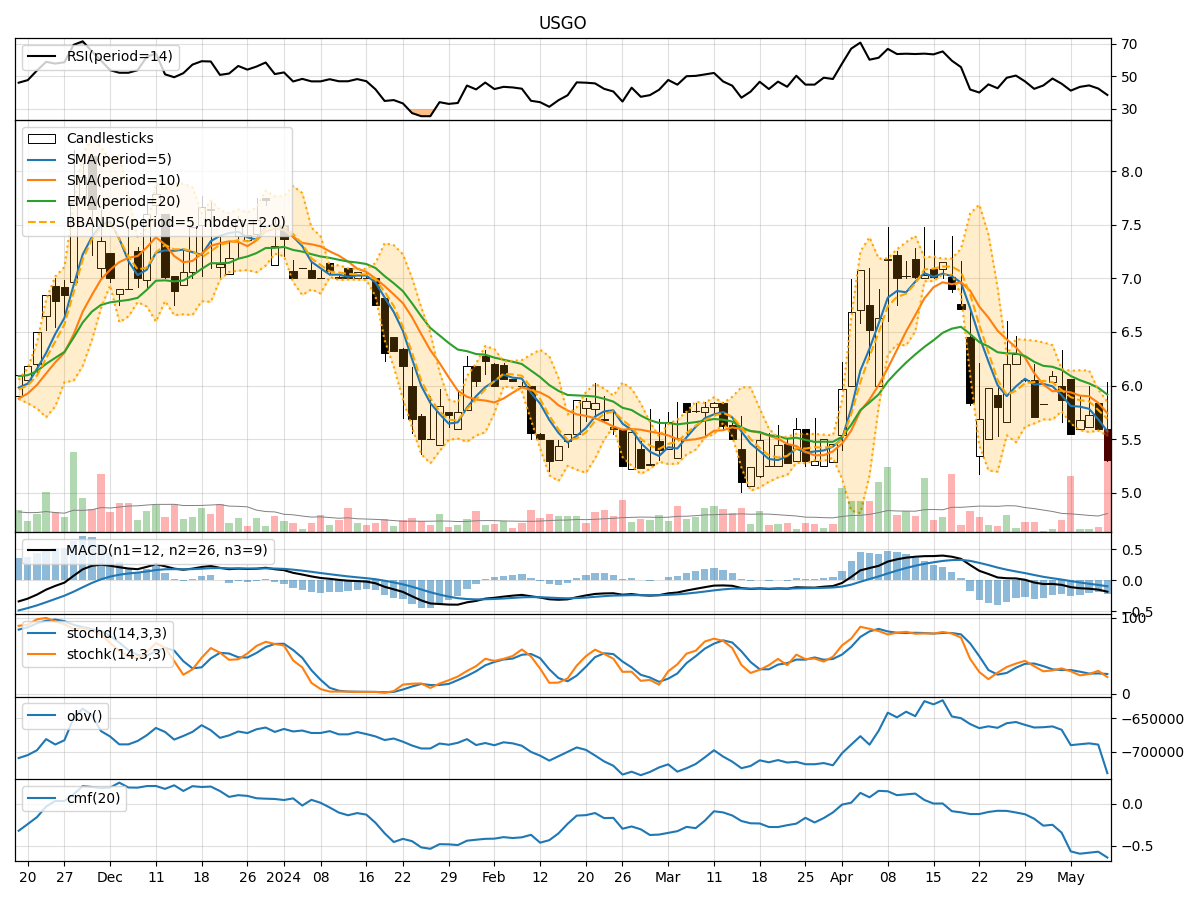
In analyzing the technical indicators for USGO stock over the last 5 days, we will delve into the trends, momentum, volatility, and volume aspects to provide a comprehensive outlook on the possible stock price movement in the coming days. By examining key indicators such as moving averages, MACD, RSI, Bollinger Bands, and OBV, we aim to offer valuable insights and predictions for potential price action.
Trend Analysis:
- Moving Averages (MA): The 5-day MA has been consistently below the closing prices, indicating a short-term downtrend.
- MACD: The MACD line has been negative, with the MACD histogram showing a decreasing trend, signaling a bearish momentum.
Momentum Analysis:
- RSI: The RSI has been below 50, suggesting a bearish momentum in the stock.
- Stochastic Oscillator: Both %K and %D have been trending downwards, indicating a potential continuation of the bearish momentum.
Volatility Analysis:
- Bollinger Bands (BB): The stock price has been trading below the lower Bollinger Band, indicating oversold conditions and potential for a reversal.
Volume Analysis:
- On-Balance Volume (OBV): The OBV has been negative, suggesting distribution and selling pressure in the stock.
Key Observations:
- The stock is currently in a downtrend based on moving averages and MACD.
- Momentum indicators like RSI and Stochastic Oscillator support the bearish sentiment.
- Volatility is relatively high, as indicated by the stock trading below the lower Bollinger Band.
- Volume indicators show a negative OBV, indicating selling pressure.
Conclusion:
Based on the analysis of the technical indicators, the outlook for USGO stock in the next few days is bearish. The stock is likely to continue its downward movement, potentially experiencing further price declines. Traders and investors should exercise caution and consider shorting or staying on the sidelines until a clear reversal pattern emerges. It is advisable to closely monitor key support levels and wait for signs of a trend reversal before considering any long positions.