Technical Analysis of VEON 2024-05-10
Overview:
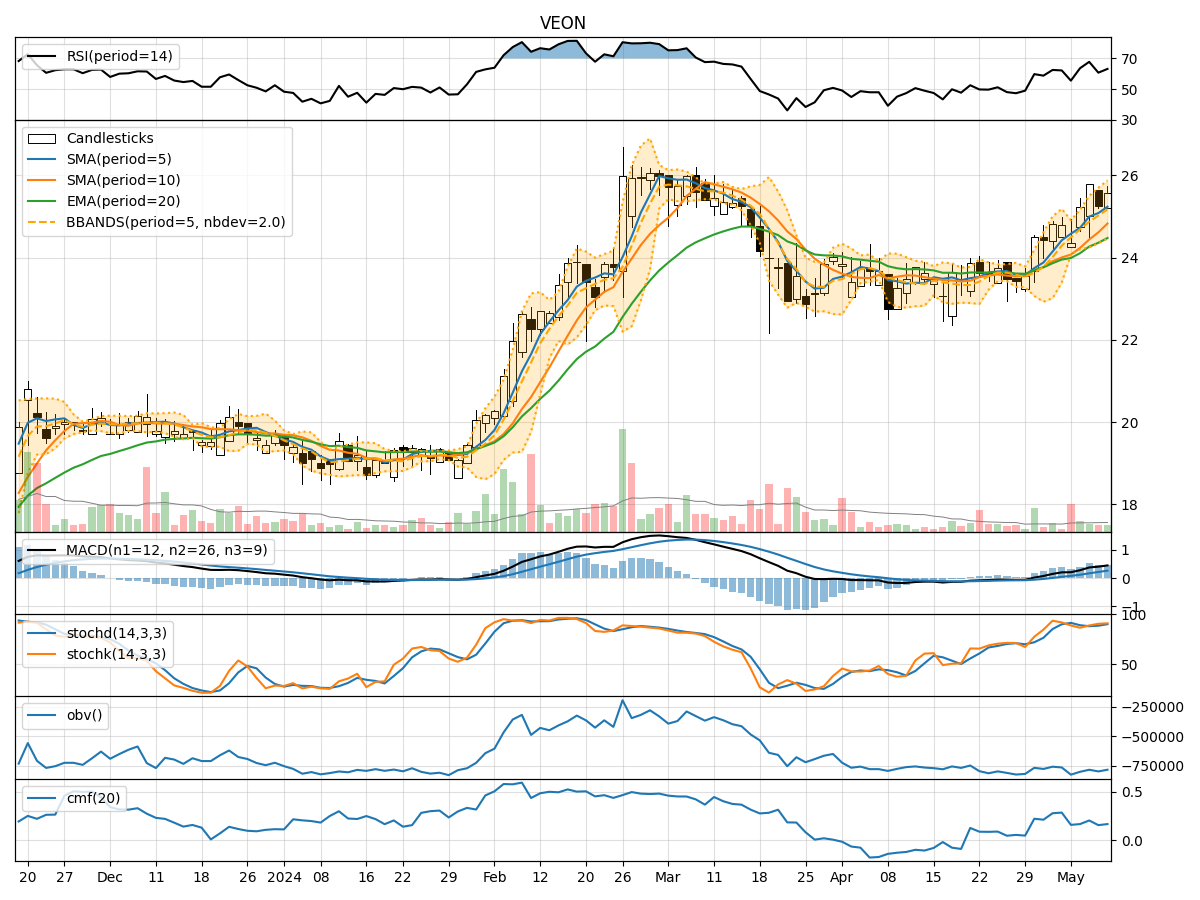
In analyzing the technical indicators for VEON over the last 5 days, we will delve into the trend, momentum, volatility, and volume indicators to provide a comprehensive outlook on the possible stock price movement. By examining these key aspects, we aim to offer valuable insights and predictions for the upcoming days.
Trend Indicators:
- Moving Averages (MA): The 5-day Moving Average has been consistently above the closing prices, indicating a short-term uptrend.
- MACD: The MACD line has been above the signal line for the past 5 days, suggesting bullish momentum.
- EMA: The Exponential Moving Average has been trending upwards, supporting the bullish sentiment.
Momentum Indicators:
- RSI: The Relative Strength Index has been fluctuating around the 50 level, indicating a neutral stance in momentum.
- Stochastic Oscillator: Both %K and %D have been in the overbought territory, signaling a potential reversal.
- Williams %R: The indicator has been hovering in the oversold region, suggesting a possible bullish reversal.
Volatility Indicators:
- Bollinger Bands: The bands have been widening, indicating increased volatility in the stock price.
- Bollinger %B: The %B indicator has been fluctuating within a range, reflecting mixed signals in volatility.
Volume Indicators:
- On-Balance Volume (OBV): The OBV has been showing a slight decrease, suggesting some distribution in the stock.
- Chaikin Money Flow (CMF): The CMF has been positive but relatively flat, indicating a neutral stance in volume flow.
Key Observations:
- The trend indicators suggest a bullish sentiment in the short term.
- Momentum indicators show mixed signals with a potential for a bullish reversal.
- Volatility has increased, indicating potential price swings.
- Volume indicators reflect a neutral volume flow with a slight distribution.
Conclusion:
Based on the analysis of the technical indicators, the next few days for VEON stock price movement could see further upside potential in the short term. The bullish trend, supported by the MACD and EMA, may continue, although caution is advised due to the mixed signals in momentum and volatility. Traders should closely monitor key levels and potential reversal points indicated by the stochastic oscillator and Williams %R. Overall, a cautiously bullish view is warranted for the upcoming days.