Technical Analysis of VERO 2024-05-10
Overview:
In analyzing the technical indicators for VERO over the last 5 days, we will delve into the trend, momentum, volatility, and volume indicators to provide a comprehensive outlook on the possible stock price movement in the coming days. By examining these key aspects, we aim to offer valuable insights and predictions to guide your investment decisions.
Trend Indicators:
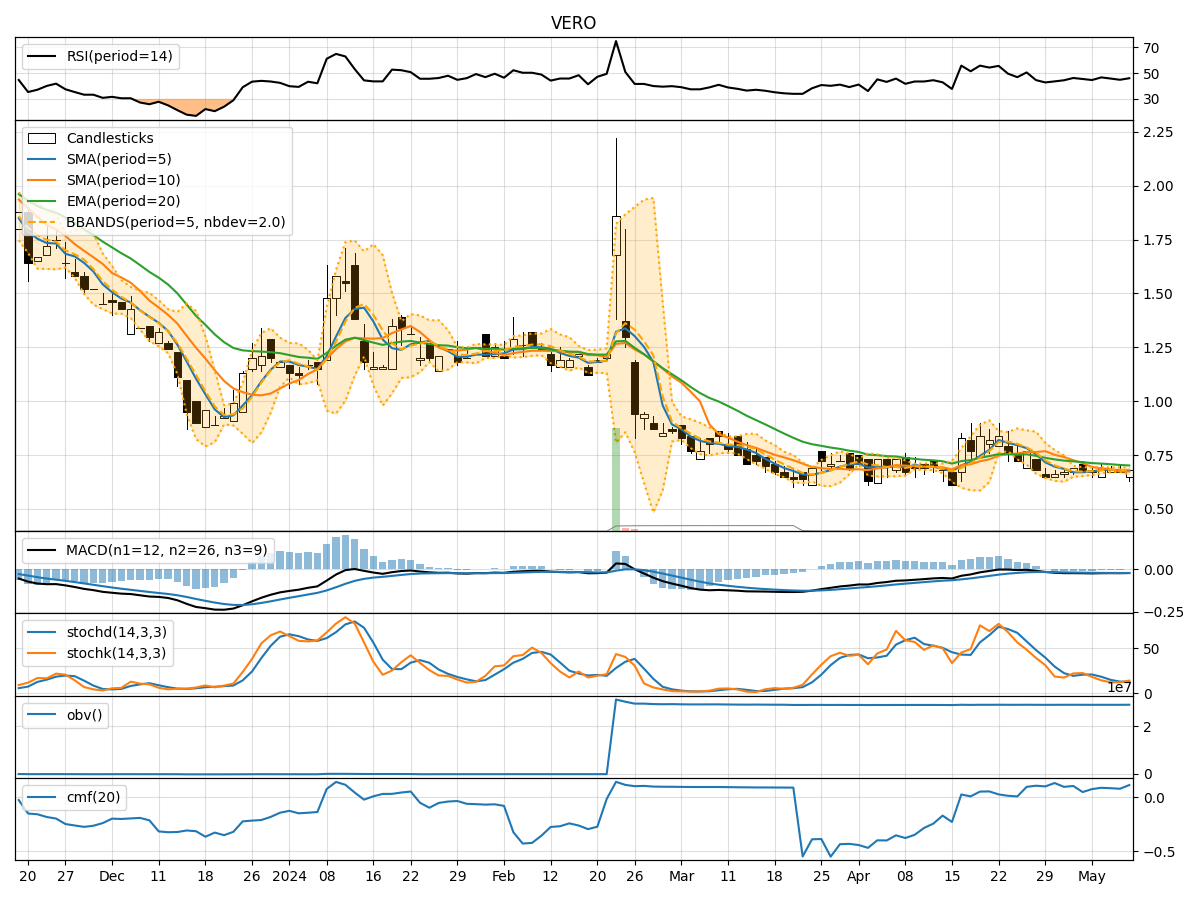
- Moving Averages (MA): The 5-day MA has been relatively stable around 0.678, indicating a short-term trend. However, it is below both the SMA(10) and EMA(20), suggesting a potential bearish sentiment.
- MACD: The MACD line has been consistently negative, indicating a bearish trend. The MACD histogram has shown slight improvement but remains in negative territory.
- Conclusion: The trend indicators point towards a bearish outlook for VERO in the short term.
Momentum Indicators:
- RSI: The RSI has been hovering around 45, indicating a neutral sentiment without any extreme overbought or oversold conditions.
- Stochastic Oscillator: Both %K and %D have been relatively low, suggesting a lack of strong momentum in either direction.
- Conclusion: Momentum indicators reflect a neutral stance with no clear directional bias.
Volatility Indicators:
- Bollinger Bands (BB): The stock price has been trading within the bands, indicating moderate volatility. The bands have not shown significant expansion or contraction.
- Conclusion: Volatility indicators suggest a stable price movement with no imminent spikes expected.
Volume Indicators:
- On-Balance Volume (OBV): The OBV has shown slight fluctuations but has not exhibited a clear trend. This indicates mixed sentiment among investors regarding volume accumulation.
- Chaikin Money Flow (CMF): The CMF has been relatively low, indicating a lack of strong buying or selling pressure.
- Conclusion: Volume indicators signal a neutral volume accumulation with no significant buying or selling pressure.
Overall Conclusion:
Based on the analysis of trend, momentum, volatility, and volume indicators, the overall outlook for VERO in the next few days is bearish. The trend indicators suggest a downward bias, while momentum and volume indicators indicate a lack of strong buying interest. Volatility remains stable, indicating no major price fluctuations expected.
Recommendation:
Considering the bearish trend and neutral momentum, investors may consider exercising caution or adopting a wait-and-see approach before making any significant trading decisions. It is advisable to monitor the stock closely for any potential reversal signals or shifts in market sentiment before taking any action.
Disclaimer:
Please note that technical analysis is not a guaranteed predictor of future price movements, and other fundamental factors can influence stock prices. It is essential to conduct thorough research and consider multiple indicators before making investment decisions. Consulting with a financial advisor is recommended for personalized guidance tailored to your specific investment goals and risk tolerance level.