Technical Analysis of VERV 2024-05-10
Overview:
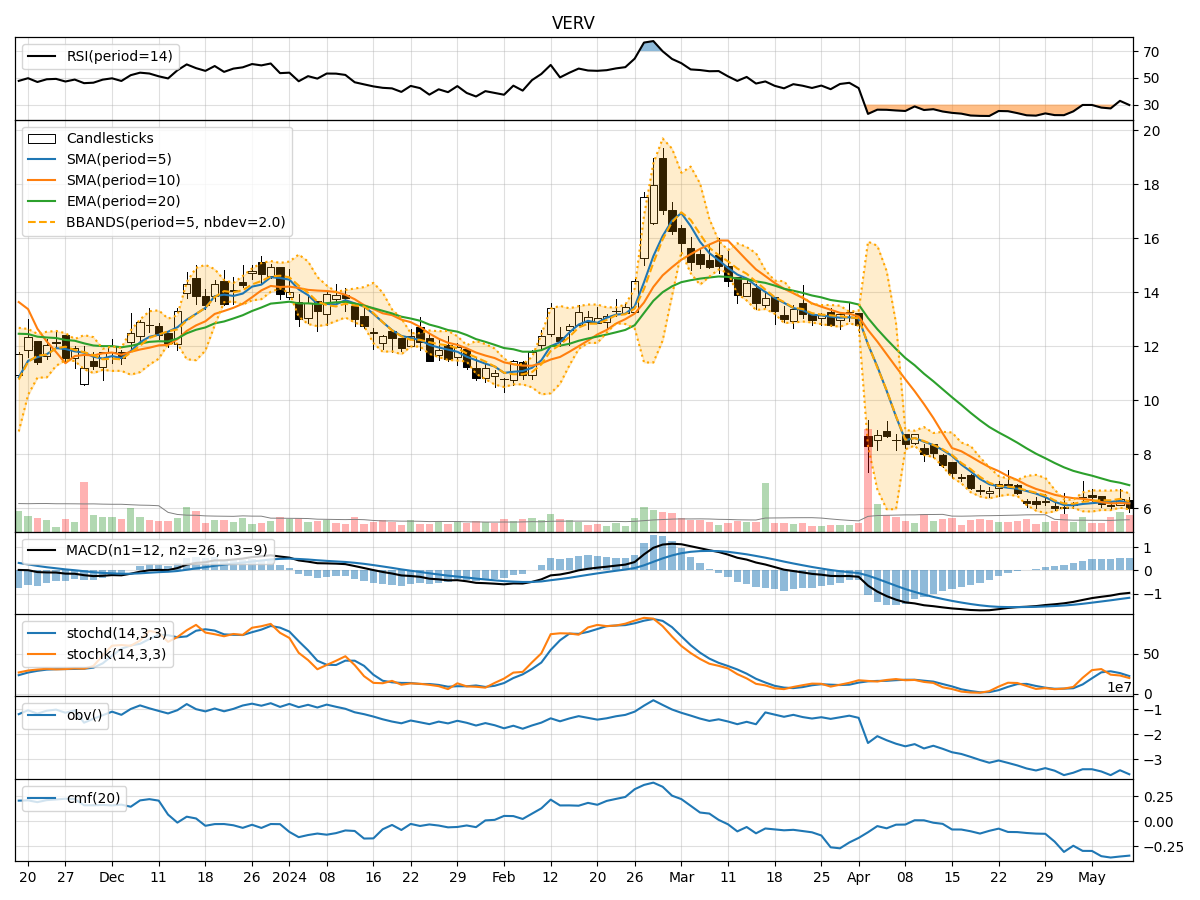
In analyzing the technical indicators for VERV over the last 5 days, we will delve into the trend, momentum, volatility, and volume indicators to provide a comprehensive outlook on the possible stock price movement in the coming days. By examining these key indicators, we aim to offer valuable insights and recommendations for potential investors.
Trend Analysis:
- Moving Averages (MA): The 5-day MA has been fluctuating around the closing prices, indicating short-term price trends. The SMA(10) and EMA(20) show a downward trend, suggesting a bearish sentiment in the medium to long term.
- MACD: The MACD line has been consistently below the signal line, indicating a bearish trend in the stock price.
- MACD Histogram: The MACD histogram has been decreasing, signaling a weakening bearish momentum.
Momentum Analysis:
- RSI: The RSI has been fluctuating in the oversold region, indicating a bearish momentum in the stock.
- Stochastic Oscillator: Both %K and %D have been trending downwards, suggesting a bearish sentiment.
- Williams %R: The indicator has been consistently in the oversold territory, indicating a bearish momentum.
Volatility Analysis:
- Bollinger Bands: The stock price has been trading within the lower Bollinger Band, indicating a potential oversold condition.
- Bollinger %B: The %B indicator has been below 1, suggesting a potential buying opportunity as the stock may be undervalued.
Volume Analysis:
- On-Balance Volume (OBV): The OBV has been decreasing, indicating a bearish volume flow in the stock.
- Chaikin Money Flow (CMF): The CMF has been negative, suggesting a bearish sentiment in the stock.
Key Observations:
- The trend indicators, momentum oscillators, and volume indicators all point towards a bearish sentiment in the stock.
- The stock price has been consistently below key moving averages, indicating a potential downtrend.
- The volatility indicators suggest that the stock may be oversold, presenting a possible buying opportunity.
Conclusion:
Based on the analysis of the technical indicators, the outlook for VERV in the next few days is bearish. The stock is likely to continue its downward trend, with momentum indicators and volume flow supporting a bearish view. Traders and investors should exercise caution and consider waiting for a potential reversal confirmation before considering any long positions. It is advisable to closely monitor the price action and key support levels for any signs of a trend reversal.