Technical Analysis of VEV 2024-05-10
Overview:
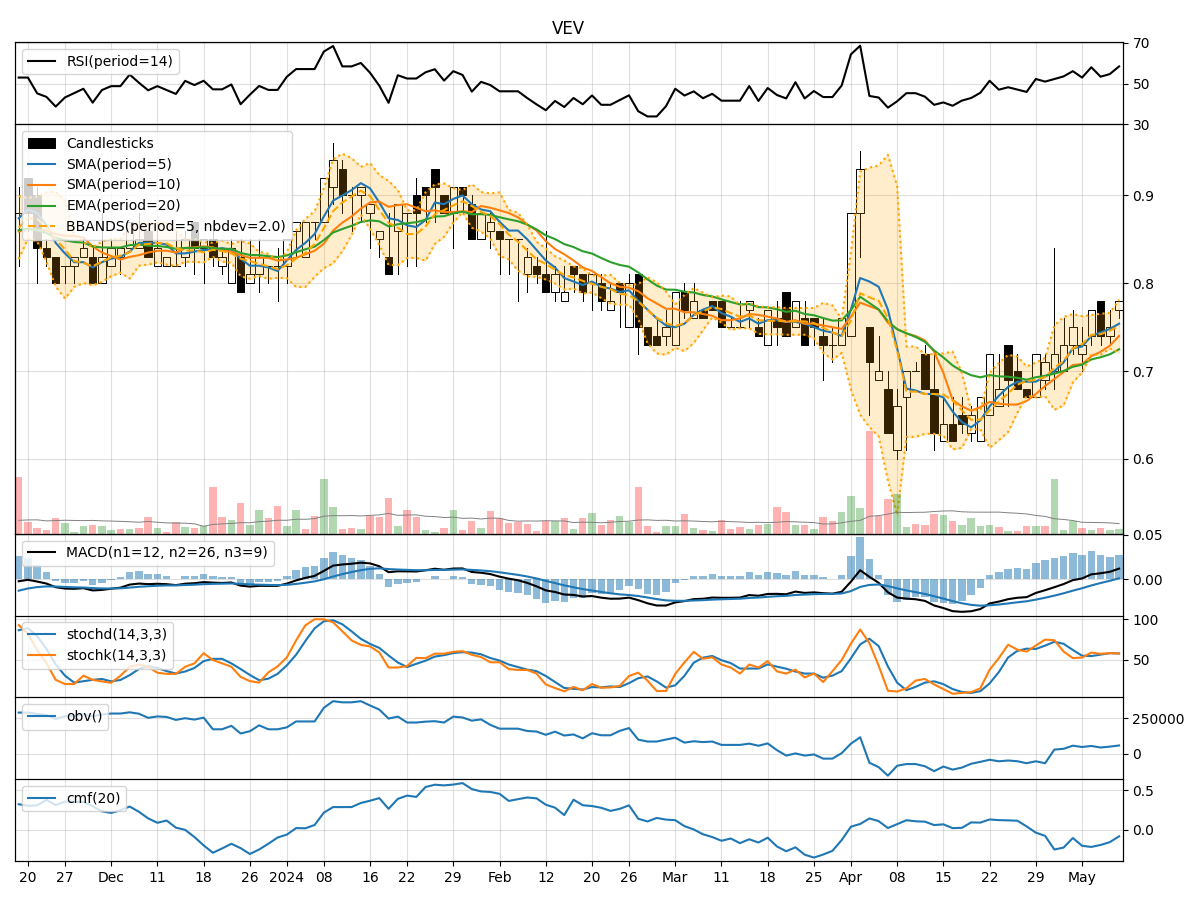
In analyzing the technical indicators for VEV stock over the last 5 days, we will delve into the trend, momentum, volatility, and volume indicators to provide a comprehensive outlook on the possible stock price movement in the coming days.
Trend Indicators:
- Moving Averages (MA): The 5-day Moving Average (MA) has been steadily increasing, indicating a positive trend in the stock price.
- MACD: The Moving Average Convergence Divergence (MACD) has been consistently positive, suggesting bullish momentum.
- EMA: The Exponential Moving Average (EMA) has also been on an upward trajectory, supporting the bullish trend.
Momentum Indicators:
- RSI: The Relative Strength Index (RSI) has been fluctuating around the neutral zone, indicating a lack of strong momentum in either direction.
- Stochastic Oscillator: Both %K and %D have shown mixed signals, with no clear indication of overbought or oversold conditions.
- Williams %R: The Williams %R is hovering near the oversold territory, suggesting a potential reversal in the short term.
Volatility Indicators:
- Bollinger Bands: The Bollinger Bands have widened, indicating increased volatility in the stock price.
- Bollinger %B: The %B indicator is fluctuating within the bands, reflecting uncertainty in the market sentiment.
Volume Indicators:
- On-Balance Volume (OBV): The OBV has been declining, signaling a decrease in buying pressure.
- Chaikin Money Flow (CMF): The CMF has also been negative, indicating a lack of strong inflow of money into the stock.
Key Observations:
- The trend indicators suggest a bullish sentiment in the stock price, supported by the positive MACD and EMA.
- Momentum indicators show mixed signals, with RSI indicating neutrality and Williams %R hinting at a potential reversal.
- Volatility has increased, as seen in the widening Bollinger Bands, which may lead to erratic price movements.
- Volume indicators reflect a decrease in buying pressure and a lack of strong inflow of money into the stock.
Conclusion:
Based on the analysis of the technical indicators, the next few days' possible stock price movement for VEV is likely to be sideways with a slight bearish bias. The mixed signals from momentum indicators, coupled with increased volatility and declining buying pressure, suggest a period of consolidation or minor pullback in the stock price. Traders should exercise caution and wait for clearer signals before making significant trading decisions.