Technical Analysis of VIRT 2024-05-10
Overview:
In analyzing the technical indicators for VIRT over the last 5 days, we will delve into the trend, momentum, volatility, and volume indicators to provide a comprehensive outlook on the possible stock price movement in the coming days. By examining these key aspects, we aim to offer valuable insights and predictions for informed decision-making.
Trend Indicators:
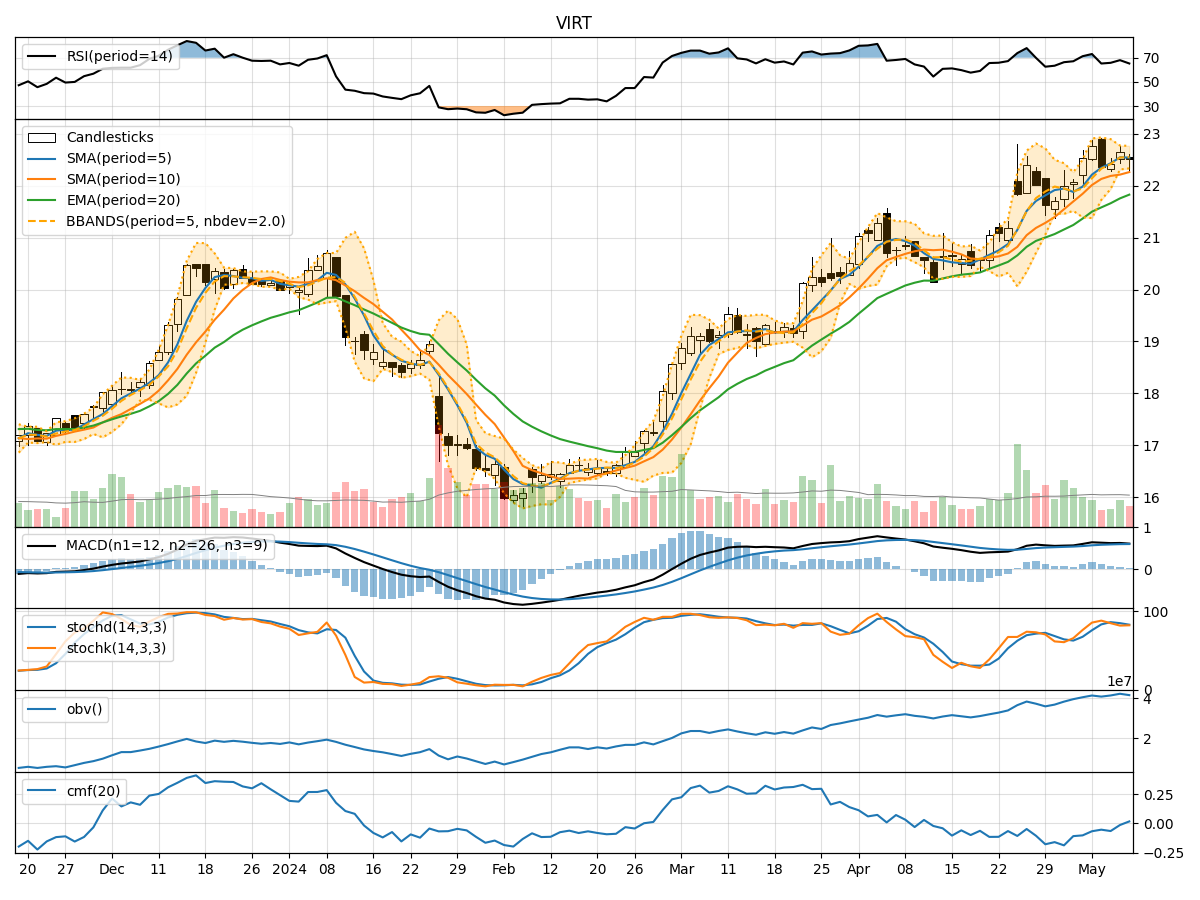
- Moving Averages (MA): The 5-day MA has been consistently above the 10-day SMA, indicating a short-term bullish trend. The EMA(20) has been steadily increasing, reflecting positive momentum.
- MACD: The MACD line has been above the signal line, suggesting bullish momentum. The MACD histogram has been mostly positive, indicating strength in the uptrend.
Momentum Indicators:
- RSI: The RSI has been fluctuating in the overbought territory, indicating strong buying pressure. However, it has shown some signs of divergence, which could signal a potential reversal.
- Stochastic Oscillator: Both %K and %D have been in the overbought zone, suggesting a possible overextension. This could lead to a pullback or consolidation in the near term.
Volatility Indicators:
- Bollinger Bands: The stock price has mostly stayed within the bands, with the %B indicator hovering around the midline. This indicates a period of consolidation or sideways movement.
- Average True Range (ATR): The ATR has shown relatively stable volatility levels, suggesting a lack of significant price fluctuations.
Volume Indicators:
- On-Balance Volume (OBV): The OBV has been fluctuating, indicating mixed buying and selling pressure. This could lead to indecision in the market.
- Chaikin Money Flow (CMF): The CMF has been negative, reflecting outflow of money from the stock. This could signal weakening bullish sentiment.
Conclusion:
Based on the analysis of the technical indicators, the stock of VIRT is currently in a consolidation phase with sideways movement expected in the near term. The bullish momentum seen in the trend indicators may face resistance due to overbought conditions in the momentum indicators. The volatility remains relatively stable, suggesting limited price swings.
Key Points: - Short-term Outlook: Neutral with a slight bearish bias due to potential reversal signals in the momentum indicators. - Recommendation: Exercise caution and wait for clearer signals before making significant trading decisions. Monitor key support and resistance levels for potential breakout opportunities.
By considering the interplay of trend, momentum, volatility, and volume indicators, investors can better navigate the market dynamics and make informed decisions aligned with their risk tolerance and investment goals.