Technical Analysis of VLY 2024-05-10
Overview:
In analyzing the technical indicators for VLY over the last 5 days, we will delve into the trend, momentum, volatility, and volume indicators to provide a comprehensive outlook on the possible stock price movement in the coming days. By examining these key aspects, we aim to offer valuable insights and recommendations for potential investors.
Trend Analysis:
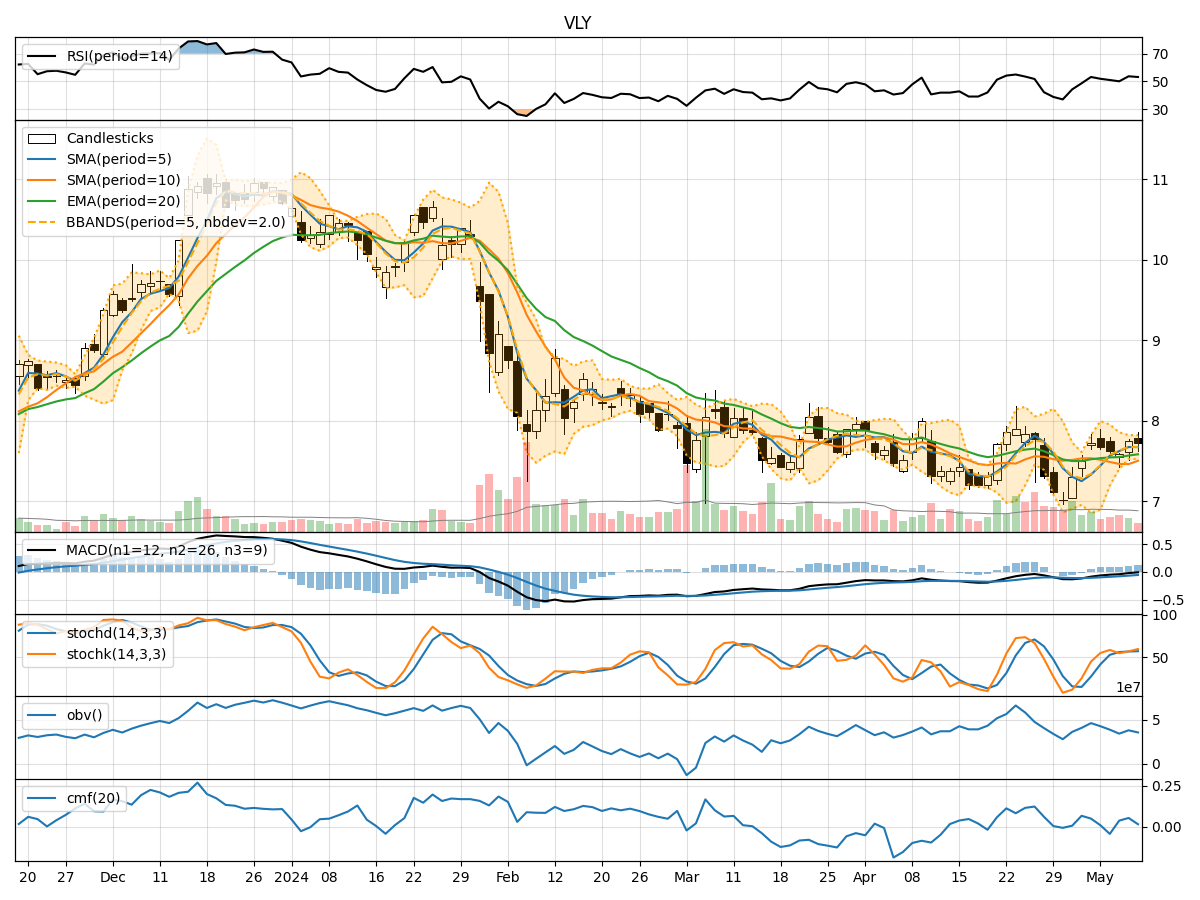
- Moving Averages (MA): The 5-day Moving Average (MA) has been consistently above the Simple Moving Average (SMA) and Exponential Moving Average (EMA) over the past 5 days, indicating a short-term bullish trend.
- MACD: The Moving Average Convergence Divergence (MACD) has shown positive values, with the MACD line consistently above the Signal line, suggesting bullish momentum in the stock price.
Momentum Analysis:
- RSI: The Relative Strength Index (RSI) has been fluctuating around the 50 level, indicating a neutral momentum in the stock.
- Stochastic Oscillator: Both %K and %D lines of the Stochastic Oscillator have been hovering around the mid-level, suggesting a lack of strong directional momentum.
- Williams %R: The Williams %R indicator has been in the oversold territory, indicating a potential buying opportunity.
Volatility Analysis:
- Bollinger Bands: The Bollinger Bands have shown narrowing bands, indicating decreasing volatility in the stock price.
- Bollinger %B: The %B indicator has been fluctuating around 0.5, suggesting the stock is trading around the middle of the bands.
Volume Analysis:
- On-Balance Volume (OBV): The OBV indicator has shown mixed movements, indicating indecision among market participants.
- Chaikin Money Flow (CMF): The CMF has been positive, suggesting that money flow into the stock has been relatively strong over the past 20 days.
Key Observations:
- The trend indicators point towards a bullish sentiment in the short term.
- Momentum indicators suggest a lack of strong directional momentum.
- Volatility has been decreasing, indicating potential consolidation.
- Volume indicators show mixed signals, reflecting uncertainty among investors.
Conclusion:
Based on the analysis of the technical indicators, the next few days for VLY stock price movement could see sideways consolidation with a slight bullish bias. Investors may expect the stock to trade within a narrow range as it consolidates recent gains. It is advisable to closely monitor key support and resistance levels for potential breakout or breakdown scenarios.