Technical Analysis of VTRS 2024-05-10
Overview:
In analyzing the technical indicators for VTRS over the last 5 days, we will delve into the trend, momentum, volatility, and volume indicators to provide a comprehensive outlook on the possible stock price movement in the coming days.
Trend Analysis:
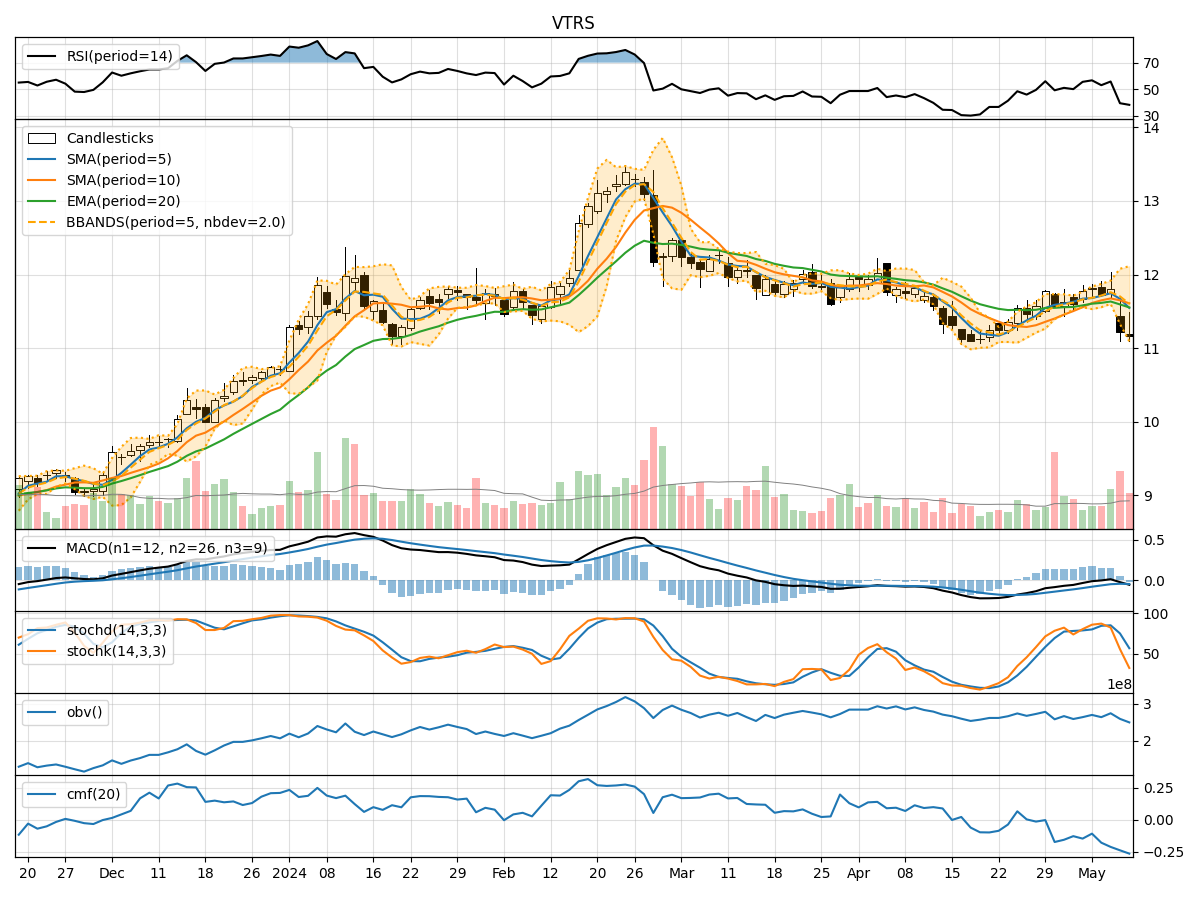
- Moving Averages (MA): The 5-day Moving Average (MA) has been fluctuating around the closing prices, indicating short-term price trends. The Simple Moving Average (SMA) and Exponential Moving Average (EMA) show a slight upward trend.
- MACD: The Moving Average Convergence Divergence (MACD) has been negative, but the MACD Histogram is showing signs of convergence towards the signal line.
Momentum Analysis:
- RSI: The Relative Strength Index (RSI) has been fluctuating around the 50 level, indicating a lack of strong momentum in either direction.
- Stochastic Oscillator: Both %K and %D of the Stochastic Oscillator are in oversold territory, suggesting a potential reversal in the short term.
- Williams %R: The Williams %R is deeply in oversold territory, indicating a possible buying opportunity.
Volatility Analysis:
- Bollinger Bands (BB): The Bollinger Bands are narrowing, suggesting decreasing volatility in the stock price.
- Bollinger %B: The %B indicator is hovering around the midline, indicating a balanced market sentiment.
Volume Analysis:
- On-Balance Volume (OBV): The OBV has been declining, indicating selling pressure in the stock.
- Chaikin Money Flow (CMF): The CMF is negative, suggesting that money is flowing out of the stock.
Key Observations and Opinions:
- Trend: The moving averages show a potential upward trend, but the MACD indicates a lack of strong momentum.
- Momentum: The RSI and Stochastic Oscillator suggest a neutral to oversold condition, while the Williams %R indicates a possible buying opportunity.
- Volatility: The narrowing Bollinger Bands signal decreasing volatility, which could lead to a period of consolidation.
- Volume: The declining OBV and negative CMF indicate bearish sentiment in the stock.
Conclusion:
Based on the analysis of the technical indicators, the stock price of VTRS is likely to experience sideways movement in the coming days. The lack of strong momentum, coupled with decreasing volatility and bearish volume indicators, suggests a period of consolidation. Traders may consider waiting for clearer signals before taking significant positions.