Technical Analysis of VVPR 2024-05-10
Overview:
In analyzing the technical indicators for VVPR over the last 5 days, we will delve into the trend, momentum, volatility, and volume indicators to provide a comprehensive outlook on the possible stock price movement in the coming days. By examining these key aspects, we aim to offer valuable insights and predictions for potential investors.
Trend Analysis:
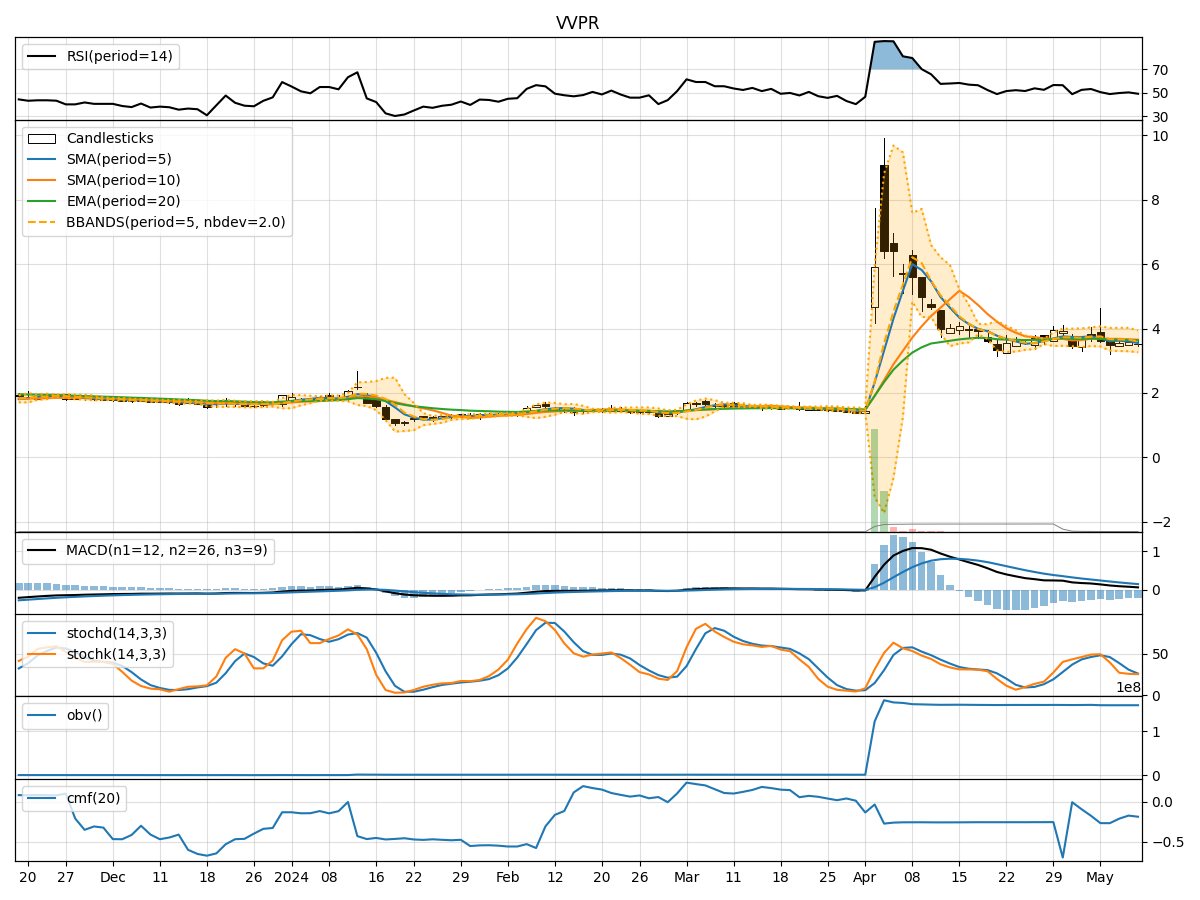
- Moving Averages (MA): The 5-day MA has been consistently below the closing prices, indicating a short-term downtrend.
- MACD: The MACD line has been positive but decreasing, while the MACD Histogram has been negative, suggesting a potential reversal or weakening of the current trend.
Momentum Analysis:
- RSI: The RSI has been hovering around the neutral zone, indicating a lack of strong momentum in either direction.
- Stochastic Oscillator: Both %K and %D have been in oversold territory, signaling a potential reversal to the upside.
- Williams %R: The indicator has been in oversold territory, suggesting a possible buying opportunity.
Volatility Analysis:
- Bollinger Bands (BB): The stock price has been trading within the lower Bollinger Band, indicating oversold conditions.
- Bollinger %B: The %B indicator has been below 0.2, signaling a potential bounce back in price.
Volume Analysis:
- On-Balance Volume (OBV): The OBV has been relatively stable, indicating a balance between buying and selling pressure.
- Chaikin Money Flow (CMF): The CMF has been negative, suggesting outflow of money from the stock.
Key Observations:
- The stock is currently in a short-term downtrend based on moving averages.
- Momentum indicators suggest a possible reversal to the upside due to oversold conditions.
- Volatility indicators point towards potential price recovery from oversold levels.
- Volume indicators show a balance between buying and selling pressure.
Conclusion:
Based on the analysis of the technical indicators, the stock of VVPR is likely to experience a short-term upward movement in the coming days. The oversold conditions indicated by momentum and volatility indicators, coupled with the potential reversal signals from the stochastic oscillator and Williams %R, suggest a possible price recovery. However, investors should closely monitor the price action and key resistance levels for confirmation of the uptrend.