Technical Analysis of WAFU 2024-05-10
Overview:
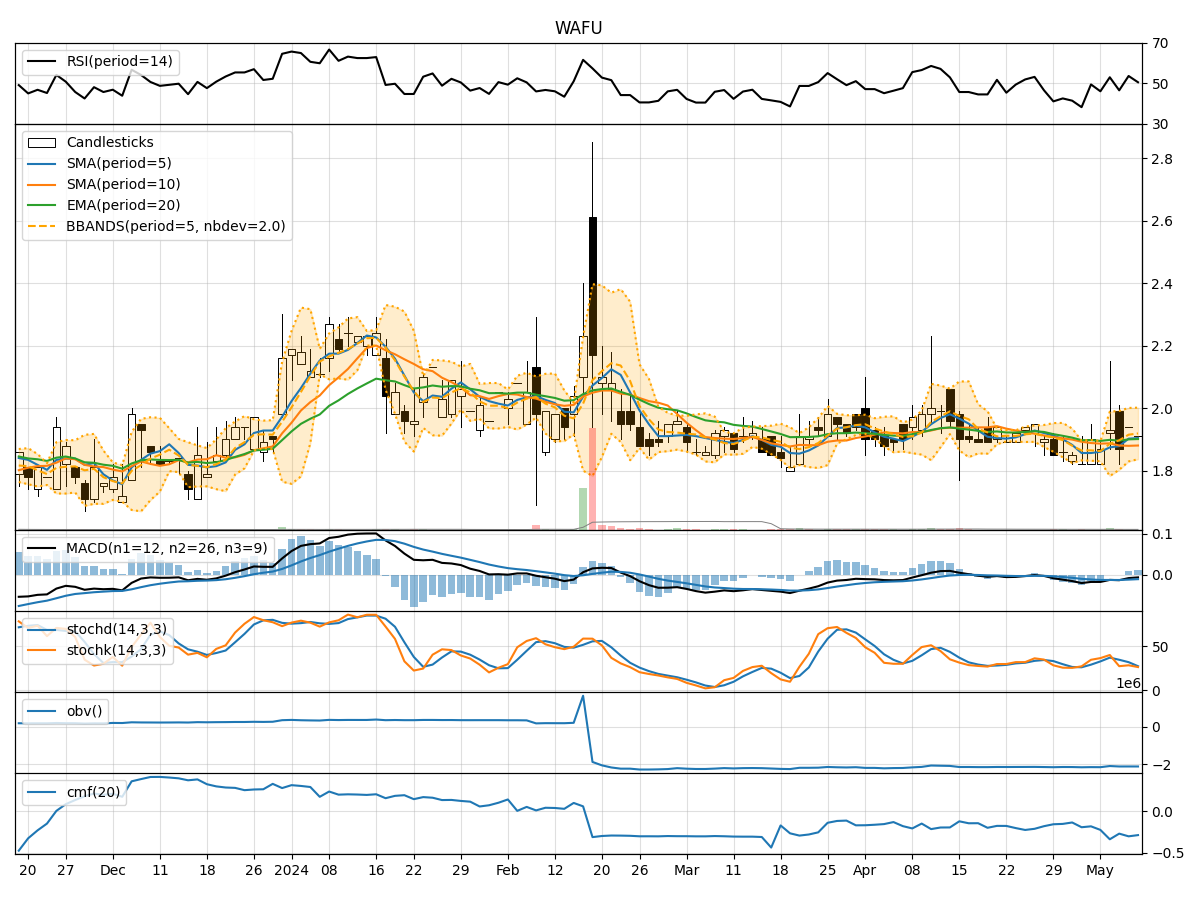
In analyzing the technical indicators for WAFU over the last 5 days, we will delve into the trend, momentum, volatility, and volume indicators to provide a comprehensive assessment of the stock's potential price movement. By examining these key factors, we aim to offer valuable insights and predictions for the next few days.
Trend Analysis:
- Moving Averages (MA): The 5-day Moving Average (MA) has been fluctuating around the closing prices, indicating a lack of clear trend direction.
- MACD and Signal Line: The MACD has been consistently negative, suggesting a bearish momentum in the short term.
- Exponential Moving Average (EMA): The EMA has been relatively stable but slightly declining, reflecting a potential weakening trend.
Key Observation: The trend indicators point towards a bearish sentiment in the short term.
Momentum Analysis:
- Relative Strength Index (RSI): The RSI values have been hovering around the mid-range, indicating a neutral momentum.
- Stochastic Oscillator: Both %K and %D values have been fluctuating, showing indecision in momentum.
- Williams %R (Willams %R): The Williams %R values have been oscillating in the oversold territory, suggesting a potential reversal.
Key Observation: The momentum indicators suggest a sideways movement with a slight bullish bias.
Volatility Analysis:
- Bollinger Bands (BB): The Bollinger Bands have been relatively narrow, indicating low volatility.
- Bollinger Band %B (BB %B): The %B values have been close to the midline, reflecting a balanced volatility level.
Key Observation: Volatility indicators signal a consolidation phase with limited price fluctuations.
Volume Analysis:
- On-Balance Volume (OBV): The OBV values have been fluctuating around the zero line, indicating a balance between buying and selling pressure.
- Chaikin Money Flow (CMF): The CMF values have been negative, suggesting a slight distribution phase.
Key Observation: Volume indicators imply a neutral stance with no clear dominance from buyers or sellers.
Conclusion:
Based on the analysis of trend, momentum, volatility, and volume indicators, the next few days for WAFU are likely to see a sideways movement with a slight bullish bias. The bearish trend indicated by the MACD and EMA may be offset by the neutral momentum and low volatility levels. However, the lack of strong buying or selling pressure from volume indicators suggests a cautious approach.
Overall Assessment: The stock is expected to trade within a narrow range in the near term, with a potential for a modest upside bias. Traders should closely monitor key support and resistance levels for potential breakout opportunities.