Technical Analysis of WALD 2024-05-10
Overview:
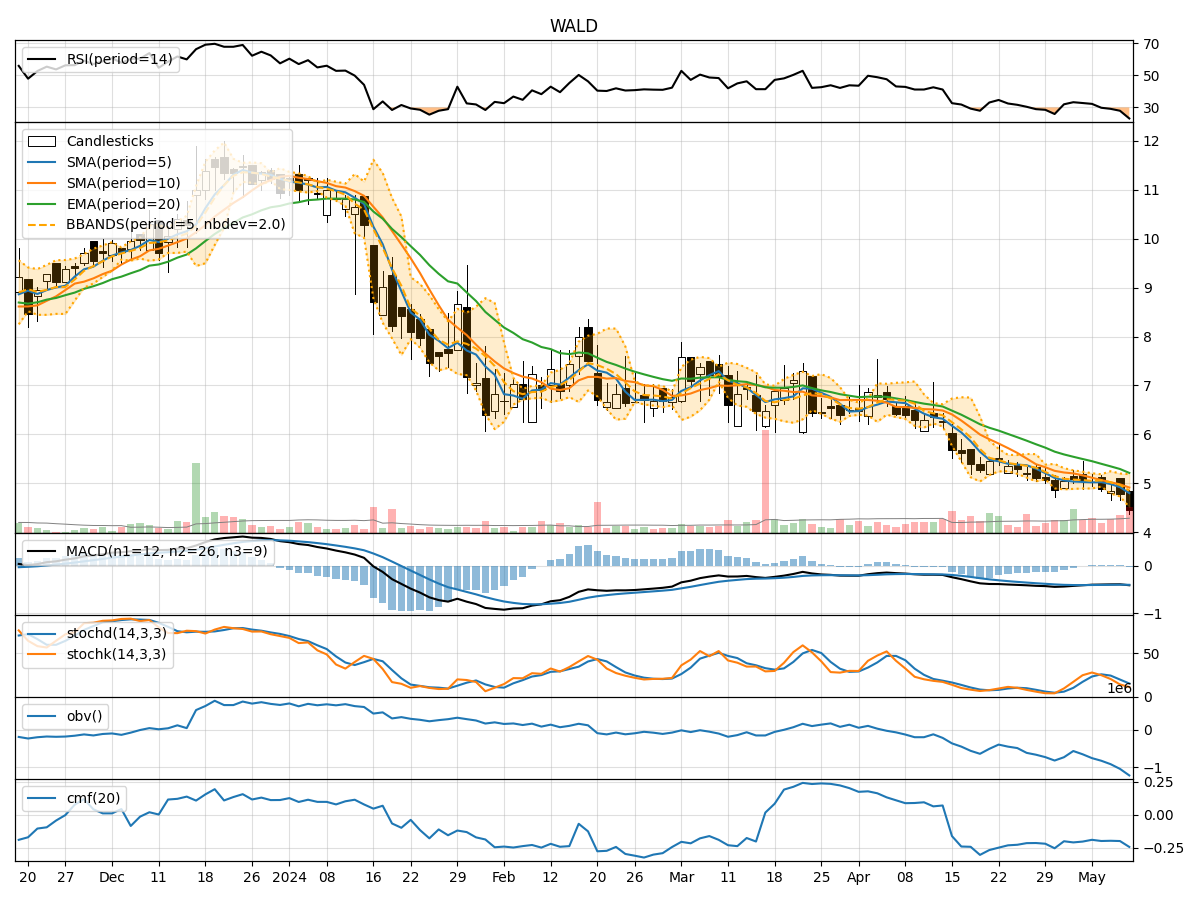
In the last 5 trading days, WALD stock has shown a consistent downward trend in both closing price and volume. The trend indicators, momentum indicators, volatility indicators, and volume indicators all point towards a bearish sentiment in the market. The Moving Average Convergence Divergence (MACD) is negative, Relative Strength Index (RSI) is low, Bollinger Bands are widening, and On-Balance Volume (OBV) is decreasing. Based on these indicators, the stock is likely to continue its downward movement in the next few days.
Trend Indicators:
- Moving Averages (MA): The 5-day MA is below the 10-day Simple Moving Average (SMA), indicating a short-term bearish trend.
- MACD: The MACD line is below the signal line, suggesting a bearish signal.
- MACD Histogram: The MACD Histogram is negative, indicating downward momentum.
Momentum Indicators:
- RSI: The RSI is below 30, indicating an oversold condition and potential for a rebound, but the overall trend remains bearish.
- Stochastic Oscillator: Both %K and %D are in oversold territory, signaling a potential reversal, but confirmation is needed.
Volatility Indicators:
- Bollinger Bands: The widening of the Bollinger Bands suggests increased volatility and potential for further price movement.
Volume Indicators:
- On-Balance Volume (OBV): The OBV is declining, indicating that selling volume is outweighing buying volume.
Key Observations:
- The stock is in a clear downtrend based on trend and momentum indicators.
- Volatility is increasing, which could lead to larger price swings.
- The volume is decreasing, indicating a lack of buying interest.
Conclusion:
Based on the analysis of the technical indicators, the next few days' possible stock price movement for WALD is downward. The bearish trend is likely to continue, supported by the negative MACD, low RSI, and declining OBV. Traders should exercise caution and consider shorting or staying out of long positions until there are clear signs of a trend reversal.