Technical Analysis of WBD 2024-05-10
Overview:
In analyzing the technical indicators for WBD stock over the last 5 days, we will delve into the trend, momentum, volatility, and volume indicators to provide a comprehensive outlook on the possible stock price movement in the coming days. By examining these key indicators, we aim to offer valuable insights and predictions for informed decision-making.
Trend Analysis:
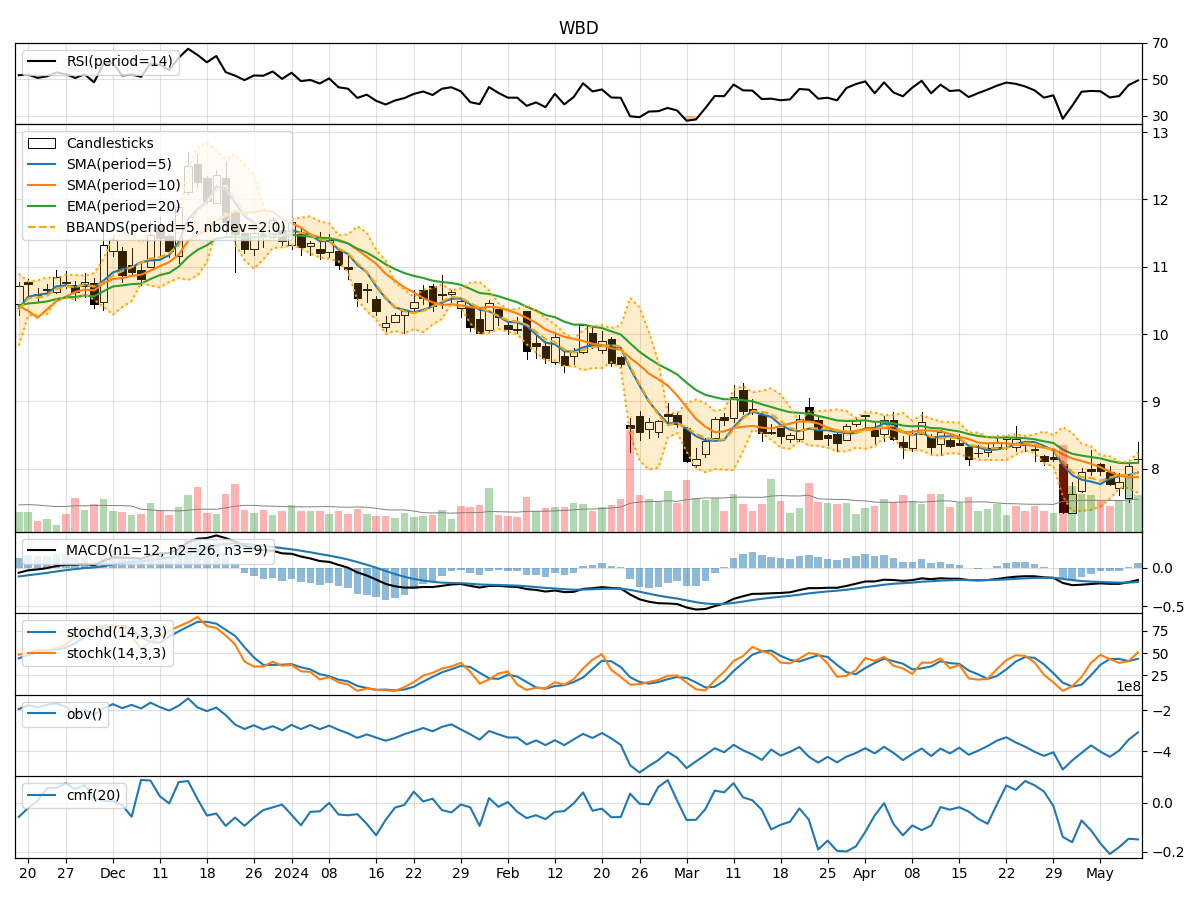
- Moving Averages (MA): The 5-day MA has been fluctuating around the closing prices, indicating short-term price trends. The SMA(10) and EMA(20) show a downward trend, suggesting a bearish sentiment in the medium to long term.
- MACD and Signal Line: The MACD has been negative, with the MACD line consistently below the signal line, indicating a bearish trend in momentum.
Momentum Analysis:
- RSI: The RSI has been below 50, indicating a bearish momentum in the stock.
- Stochastic Oscillator: Both %K and %D have been below 50, suggesting a bearish sentiment in momentum.
- Williams %R: The indicator has been in the oversold territory, signaling a bearish momentum.
Volatility Analysis:
- Bollinger Bands (BB): The stock price has been within the lower Bollinger Band, indicating a potential oversold condition and a possible reversal.
Volume Analysis:
- On-Balance Volume (OBV): The OBV has shown mixed signals, with recent days indicating a slight increase in buying pressure.
- Chaikin Money Flow (CMF): The CMF has been negative, suggesting a bearish sentiment in the stock.
Key Observations:
- The stock is currently in a bearish trend based on moving averages and momentum indicators.
- Volatility is relatively low, indicating a possible stabilization in price movements.
- The volume indicators show mixed signals, with a slight increase in buying pressure.
Conclusion:
Based on the analysis of the technical indicators, the stock is likely to continue its bearish trend in the coming days. Traders should exercise caution and consider short-selling opportunities or wait for a potential reversal confirmation before considering long positions. The stock may experience further downward movement before showing signs of stabilization. It is advisable to closely monitor the price action and key support levels for potential entry or exit points.