Technical Analysis of WEN 2024-05-10
Overview:
In analyzing the technical indicators for WEN over the last 5 days, we will delve into the trend, momentum, volatility, and volume indicators to provide a comprehensive outlook on the possible stock price movement in the coming days. By examining these key indicators, we aim to offer valuable insights and recommendations for potential investors.
Trend Analysis:
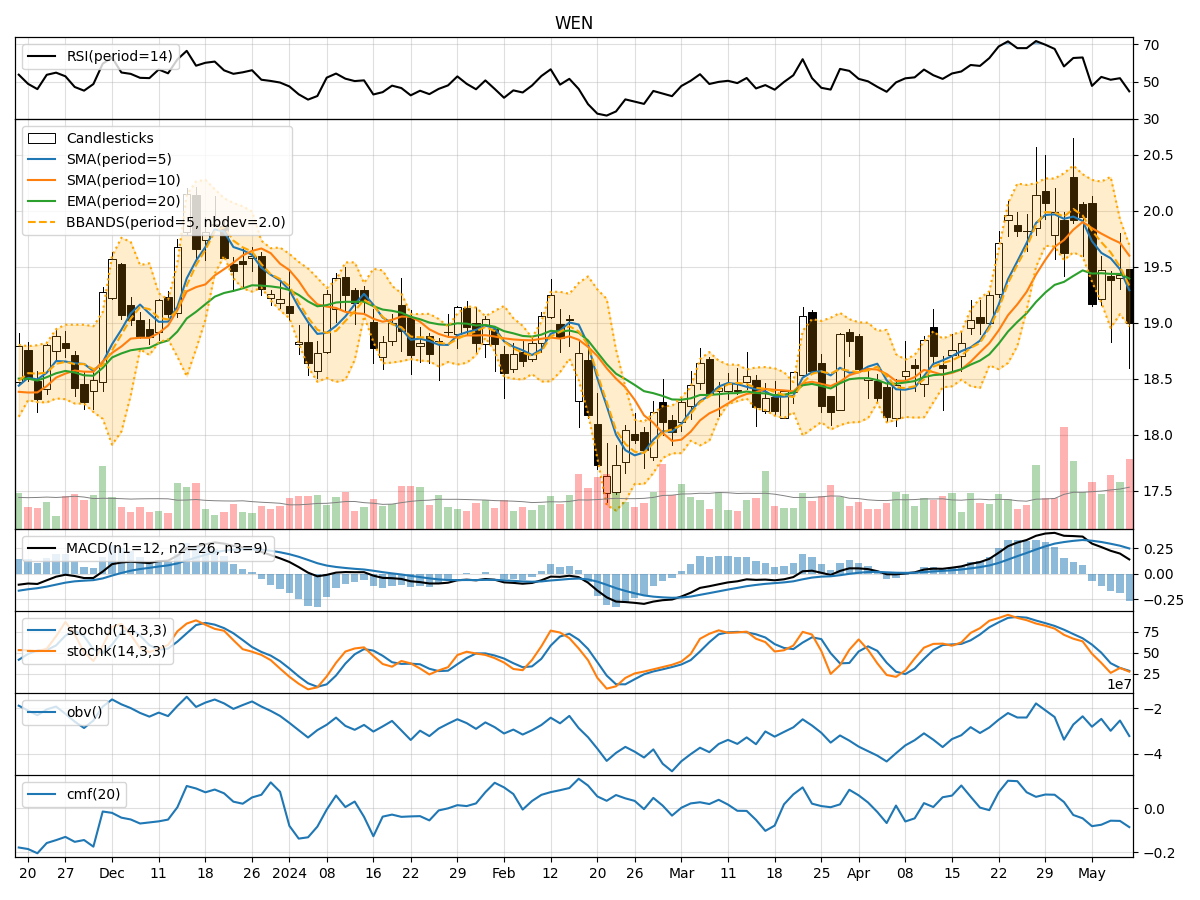
- Moving Averages (MA): The 5-day Moving Average (MA) has been consistently below the closing prices, indicating a short-term downtrend.
- MACD: The MACD line has been decreasing, suggesting a weakening trend momentum.
- EMA: The Exponential Moving Average (EMA) has been relatively stable, reflecting a lack of strong directional bias.
Momentum Analysis:
- RSI: The Relative Strength Index (RSI) has been hovering around the mid-level, indicating a neutral momentum.
- Stochastic Oscillator: Both %K and %D have been fluctuating within oversold and neutral zones, signaling indecision in momentum.
- Williams %R: The Williams %R has been in oversold territory, suggesting a potential reversal.
Volatility Analysis:
- Bollinger Bands: The Bollinger Bands have been narrowing, indicating decreasing volatility.
- Bollinger %B: The %B indicator has been relatively low, suggesting a potential consolidation phase.
Volume Analysis:
- On-Balance Volume (OBV): The OBV has been fluctuating, reflecting mixed buying and selling pressure.
- Chaikin Money Flow (CMF): The CMF has been negative, indicating a lack of strong inflow of money into the stock.
Key Observations:
- The stock is currently in a short-term downtrend based on moving averages and MACD.
- Momentum indicators show mixed signals with a neutral RSI and stochastic oscillators in oversold territory.
- Volatility is decreasing, potentially leading to a consolidation phase.
- Volume indicators suggest a lack of strong buying interest.
Conclusion:
Based on the analysis of the technical indicators, the stock price of WEN is likely to experience further downside movement in the coming days. The trend indicators, coupled with the weakening momentum and lack of strong buying interest, support a bearish view. Additionally, the decreasing volatility and potential consolidation phase indicate a period of price stabilization before any significant reversal. Investors should exercise caution and consider waiting for more definitive signals before considering any long positions.