Technical Analysis of WERN 2024-05-10
Overview:
In analyzing the technical indicators for WERN over the last 5 days, we will delve into the trend, momentum, volatility, and volume indicators to provide a comprehensive outlook on the possible stock price movement in the coming days. By examining these key indicators, we aim to offer valuable insights and predictions for potential investors and traders.
Trend Analysis:
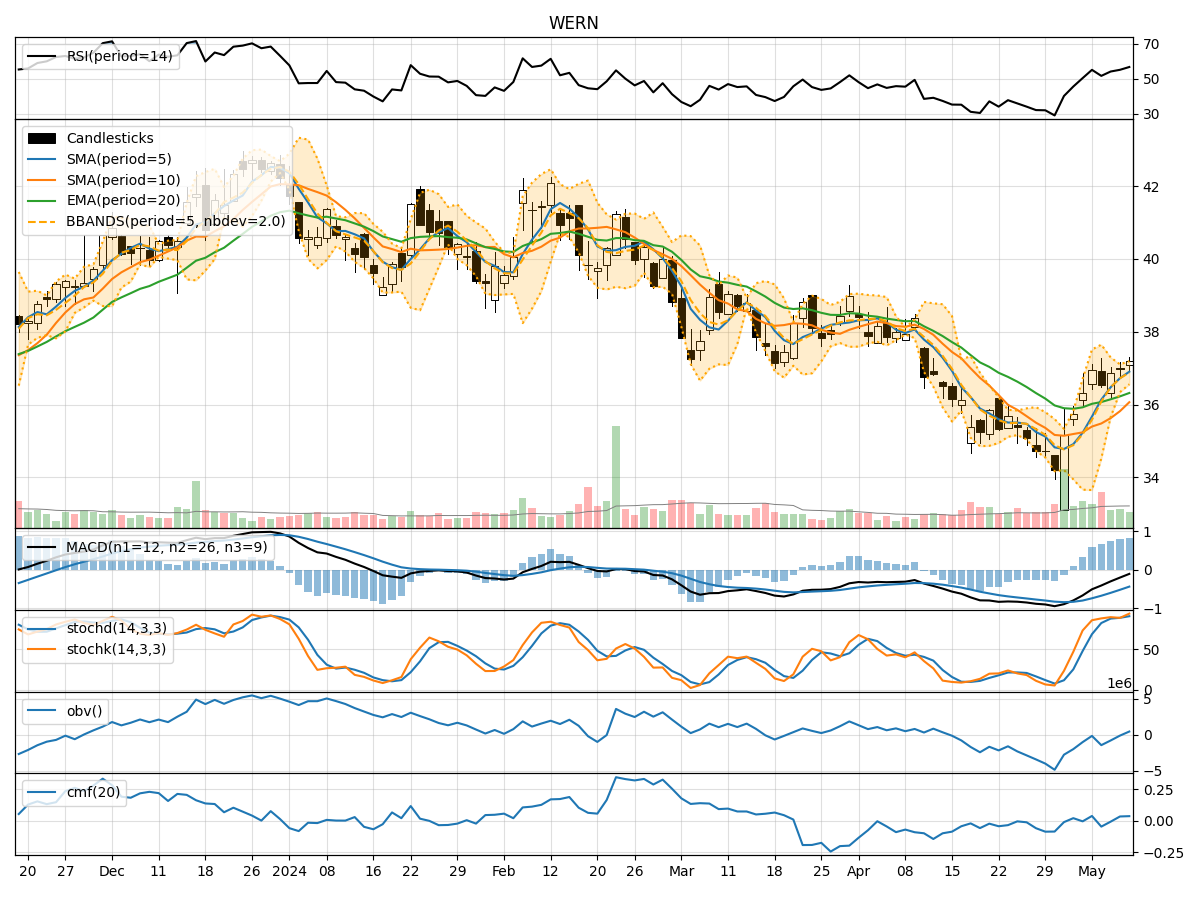
- Moving Averages (MA): The 5-day Moving Average (MA) has been consistently above the Simple Moving Average (SMA) and Exponential Moving Average (EMA), indicating a bullish trend.
- MACD: The MACD line has been negative but converging towards the signal line, suggesting a potential bullish crossover in the near future.
- MACD Histogram: The MACD Histogram has been increasing, indicating strengthening bullish momentum.
Momentum Analysis:
- RSI: The Relative Strength Index (RSI) has been gradually increasing, showing a positive momentum.
- Stochastic Oscillator: Both %K and %D lines of the Stochastic Oscillator are in the overbought zone, signaling a strong bullish momentum.
- Williams %R: The Williams %R is in the oversold region, indicating a potential reversal to the upside.
Volatility Analysis:
- Bollinger Bands: The stock price has been trading within the Bollinger Bands, with the bands narrowing, suggesting a period of consolidation.
- Bollinger %B: The %B indicator is above 0.5, indicating a bullish sentiment in the market.
Volume Analysis:
- On-Balance Volume (OBV): The OBV has shown mixed signals with fluctuations in volume, indicating indecision among market participants.
- Chaikin Money Flow (CMF): The CMF has been positive, suggesting buying pressure in the stock.
Key Observations:
- The trend indicators point towards a bullish sentiment with moving averages and MACD signaling a potential uptrend.
- Momentum indicators reflect a strong bullish momentum, especially with the Stochastic Oscillator in the overbought zone.
- Volatility indicators suggest a period of consolidation with the Bollinger Bands narrowing.
- Volume indicators show mixed signals, indicating uncertainty in market participation.
Conclusion:
Based on the analysis of the technical indicators, the overall outlook for WERN in the next few days is bullish. The trend and momentum indicators support a potential upward movement in the stock price. However, the narrowing Bollinger Bands and mixed volume signals suggest a possible period of consolidation before a significant breakout. Traders and investors should closely monitor the price action and key support/resistance levels for potential entry or exit points.
Recommendation:
- Short-term Traders: Consider entering long positions with tight stop-loss orders to capitalize on the bullish momentum.
- Long-term Investors: Hold onto existing positions with a focus on key resistance levels for potential profit-taking opportunities.
- Risk Management: Always implement proper risk management strategies to protect capital in case of unexpected market movements.
By combining technical analysis with market insights, investors can make informed decisions to navigate the dynamic stock market environment effectively.