Technical Analysis of WKME 2024-05-10
Overview:
In analyzing the technical indicators for WKME stock over the last 5 days, we will delve into the trend, momentum, volatility, and volume indicators to provide a comprehensive outlook on the possible future stock price movement. By examining these key indicators, we aim to offer valuable insights and predictions for the upcoming trading days.
Trend Analysis:
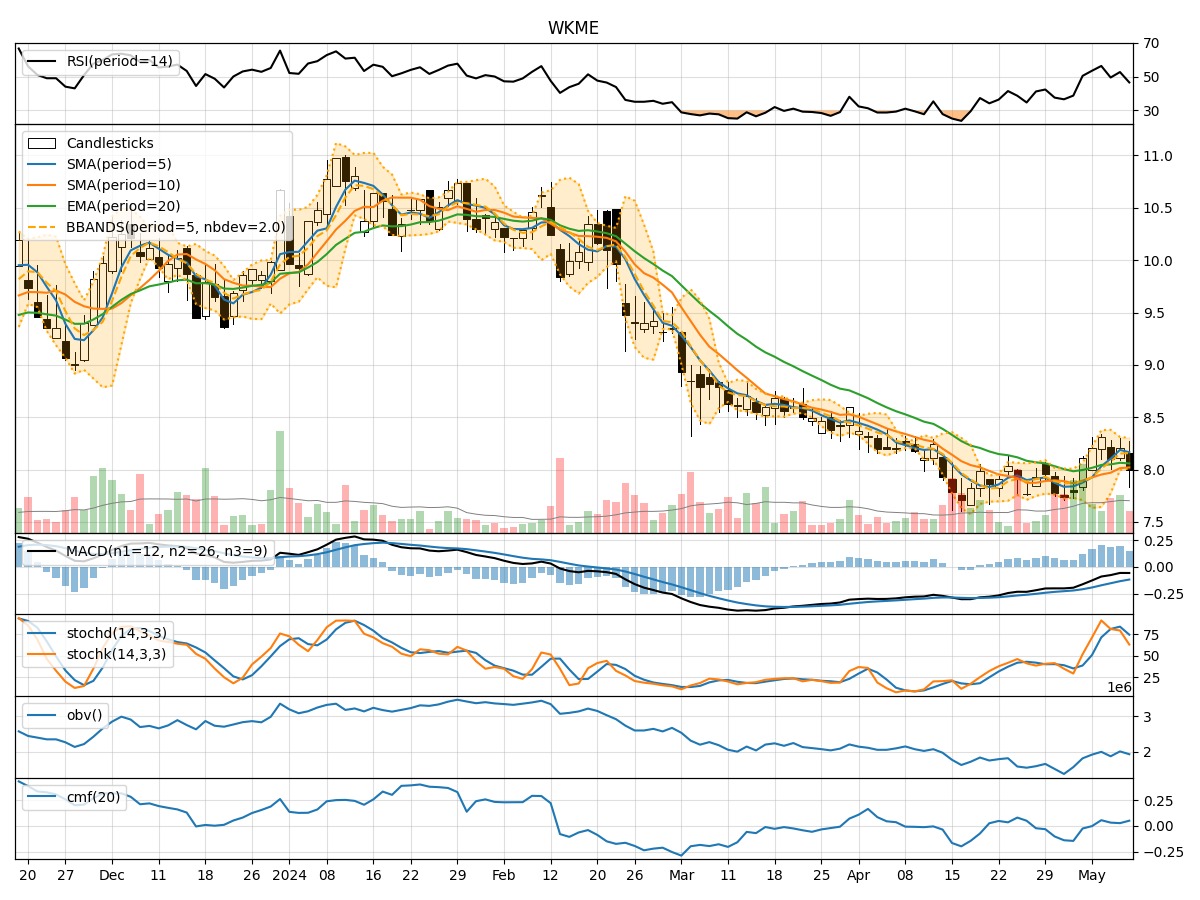
- Moving Averages (MA): The 5-day Moving Average (MA) has been fluctuating around the stock price, indicating short-term price trends. The Simple Moving Average (SMA) and Exponential Moving Average (EMA) have shown a slight upward trend, suggesting potential bullish momentum.
- Moving Average Convergence Divergence (MACD): The MACD line has been consistently below the signal line, indicating a bearish trend. However, the MACD Histogram has shown signs of convergence, hinting at a possible trend reversal.
Momentum Analysis:
- Relative Strength Index (RSI): The RSI has been oscillating within the neutral range, reflecting indecision in the market. There is no clear overbought or oversold signal based on RSI.
- Stochastic Oscillator: Both %K and %D lines of the Stochastic Oscillator have been fluctuating, suggesting a lack of strong momentum in either direction. The Williams %R indicator also indicates a neutral stance.
Volatility Analysis:
- Bollinger Bands (BB): The Bollinger Bands have shown narrowing volatility, with the stock price moving closer to the upper band. This could indicate a potential breakout or a period of consolidation.
- Bollinger %B: The %B indicator is hovering around the midpoint, signifying equilibrium between price and the bands.
Volume Analysis:
- On-Balance Volume (OBV): The OBV has been fluctuating, indicating mixed buying and selling pressure. There is no clear accumulation or distribution signal based on OBV.
- Chaikin Money Flow (CMF): The CMF has shown a slight positive trend over the past few days, suggesting some buying interest in the stock.
Conclusion:
Based on the analysis of the technical indicators, the stock price of WKME is likely to experience sideways movement in the next few days. The trend indicators show a potential for a bullish reversal, supported by the moving averages and MACD convergence. However, the lack of strong momentum signals from the RSI and Stochastic Oscillator, coupled with the narrowing volatility indicated by the Bollinger Bands, suggests a period of consolidation.
Investors should closely monitor the price action around key support and resistance levels to identify potential breakout opportunities. It is advisable to wait for confirmation from both price action and volume before making any significant trading decisions. Overall, the outlook for WKME stock is neutral to slightly bullish in the short term, with a possibility of a breakout depending on market sentiment and external factors.