Technical Analysis of WNW 2024-05-10
Overview:
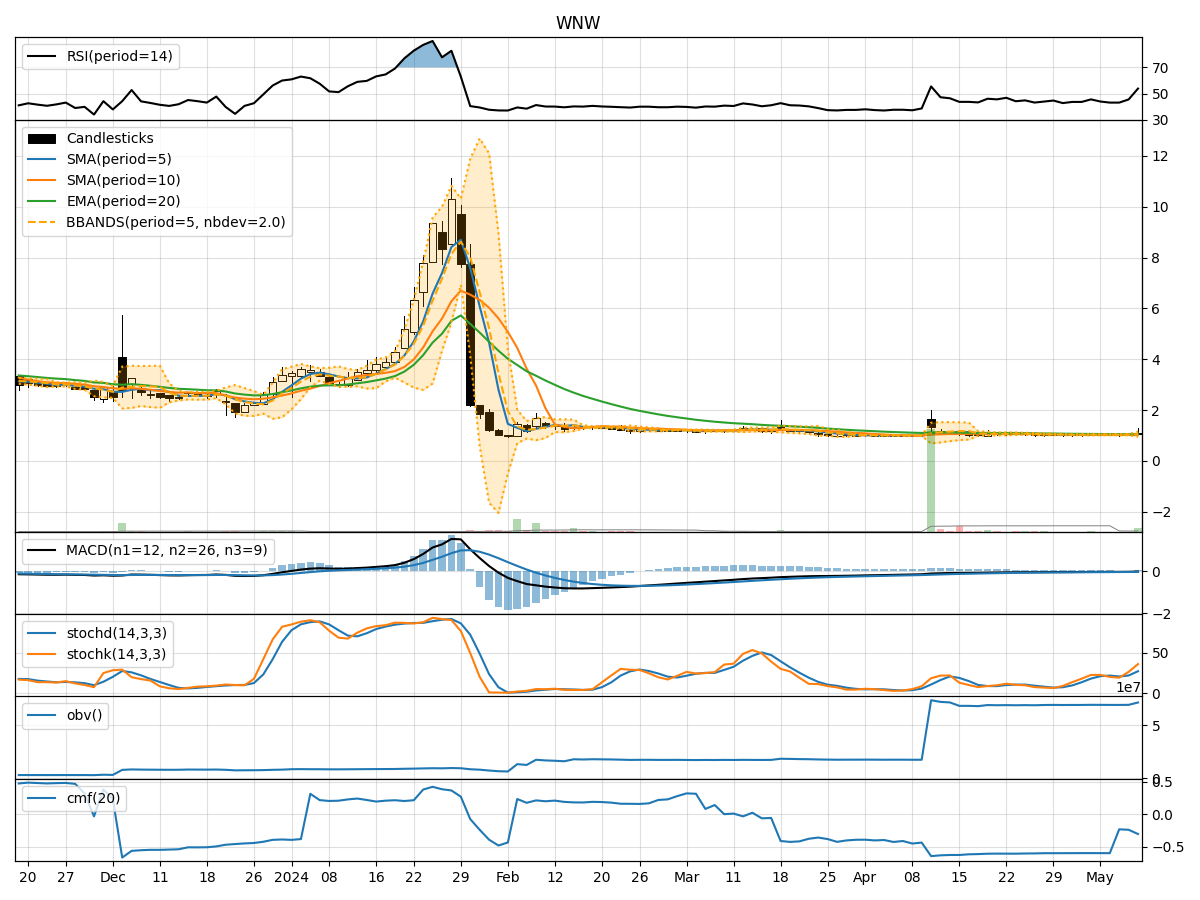
In analyzing the technical indicators for WNW over the last 5 days, we will delve into the trend, momentum, volatility, and volume indicators to provide a comprehensive outlook on the possible stock price movement. By examining these key aspects, we aim to offer valuable insights and predictions for the upcoming days.
Trend Analysis:
- Moving Averages (MA): The 5-day MA has been fluctuating around the current stock price, indicating a lack of clear trend direction.
- MACD: The MACD line has been consistently negative, suggesting a bearish momentum in the short term.
- EMA: The EMA has been gradually declining, reflecting a downward trend in the stock price.
Momentum Analysis:
- RSI: The RSI has shown a slight increase but remains below the overbought threshold, indicating a neutral momentum.
- Stochastic Oscillator: Both %K and %D have been rising, signaling a potential shift towards bullish momentum.
- Williams %R: The indicator has improved from oversold levels but still indicates a bearish sentiment.
Volatility Analysis:
- Bollinger Bands (BB): The bands have widened significantly, suggesting increased volatility in the stock price.
- BB %B: The %B indicator has been fluctuating within a wide range, reflecting the heightened volatility in the market.
Volume Analysis:
- On-Balance Volume (OBV): The OBV has shown mixed signals, with no clear trend in volume accumulation or distribution.
- Chaikin Money Flow (CMF): The CMF has been negative, indicating a lack of buying pressure in the market.
Key Observations:
- The trend indicators point towards a bearish sentiment, with the MACD and EMA signaling a downward trajectory.
- Momentum indicators show a mixed picture, with the RSI neutral, Stochastic Oscillator potentially turning bullish, and Williams %R still bearish.
- Volatility has increased significantly, as indicated by the widening Bollinger Bands.
- Volume indicators do not provide a clear direction, with OBV and CMF showing conflicting signals.
Conclusion:
Based on the analysis of the technical indicators, the stock price of WNW is likely to experience further downward movement in the next few days. The bearish trend indicated by the MACD and EMA, coupled with the lack of strong buying pressure reflected in the volume indicators, suggests a continuation of the current negative momentum. Traders and investors should exercise caution and consider short-term selling strategies or wait for more definitive signals before considering long positions.