Technical Analysis of WOOF 2024-05-10
Overview:
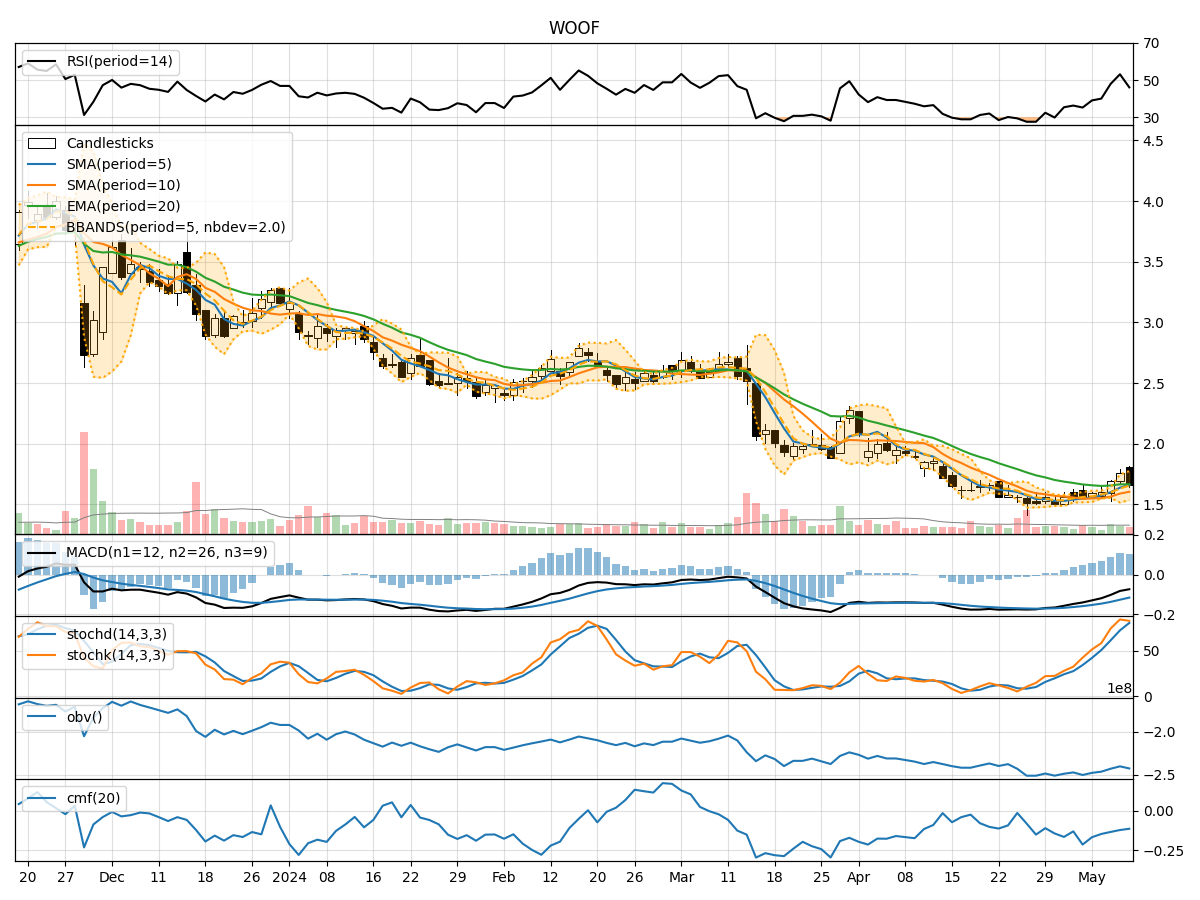
In analyzing the technical indicators for WOOF over the last 5 days, we will delve into the trends, momentum, volatility, and volume indicators to provide a comprehensive outlook on the possible stock price movement in the coming days. By examining these key aspects, we aim to offer valuable insights and predictions for informed decision-making.
Trend Analysis:
- Moving Averages (MA): The 5-day MA has been showing an upward trend, indicating a positive momentum in the stock price.
- MACD: The MACD line has been consistently below the signal line, suggesting a bearish trend in the short term.
- EMA: The EMA has been fluctuating but generally following an upward trajectory.
Momentum Analysis:
- RSI: The RSI has been fluctuating around the mid-level, indicating a neutral momentum in the stock.
- Stochastic Oscillator: Both %K and %D have been in the overbought territory, signaling a potential reversal in the stock price.
- Williams %R: The Williams %R is in the oversold region, suggesting a possible bullish reversal.
Volatility Analysis:
- Bollinger Bands (BB): The stock price has been trading within the bands, indicating a period of consolidation.
- BB Width: The width of the bands has been fluctuating, suggesting varying levels of volatility in the stock price.
Volume Analysis:
- On-Balance Volume (OBV): The OBV has been declining, indicating a potential distribution phase in the stock.
- Chaikin Money Flow (CMF): The CMF has been negative, reflecting selling pressure in the stock.
Key Observations:
- The stock is currently in a consolidation phase as indicated by the Bollinger Bands and the fluctuating EMA.
- Momentum indicators suggest a mixed sentiment with the RSI neutral, Stochastic Oscillator signaling a potential reversal, and Williams %R hinting at a bullish reversal.
- The declining OBV and negative CMF indicate a bearish sentiment in terms of volume and money flow.
Conclusion:
Based on the analysis of the technical indicators, the stock is likely to experience sideways movement in the coming days with a potential bullish bias. Traders should closely monitor the Stochastic Oscillator for a possible reversal confirmation and keep an eye on the OBV and CMF for any shifts in volume and money flow dynamics. Overall, a cautious approach with a bullish inclination is recommended for the next few days.