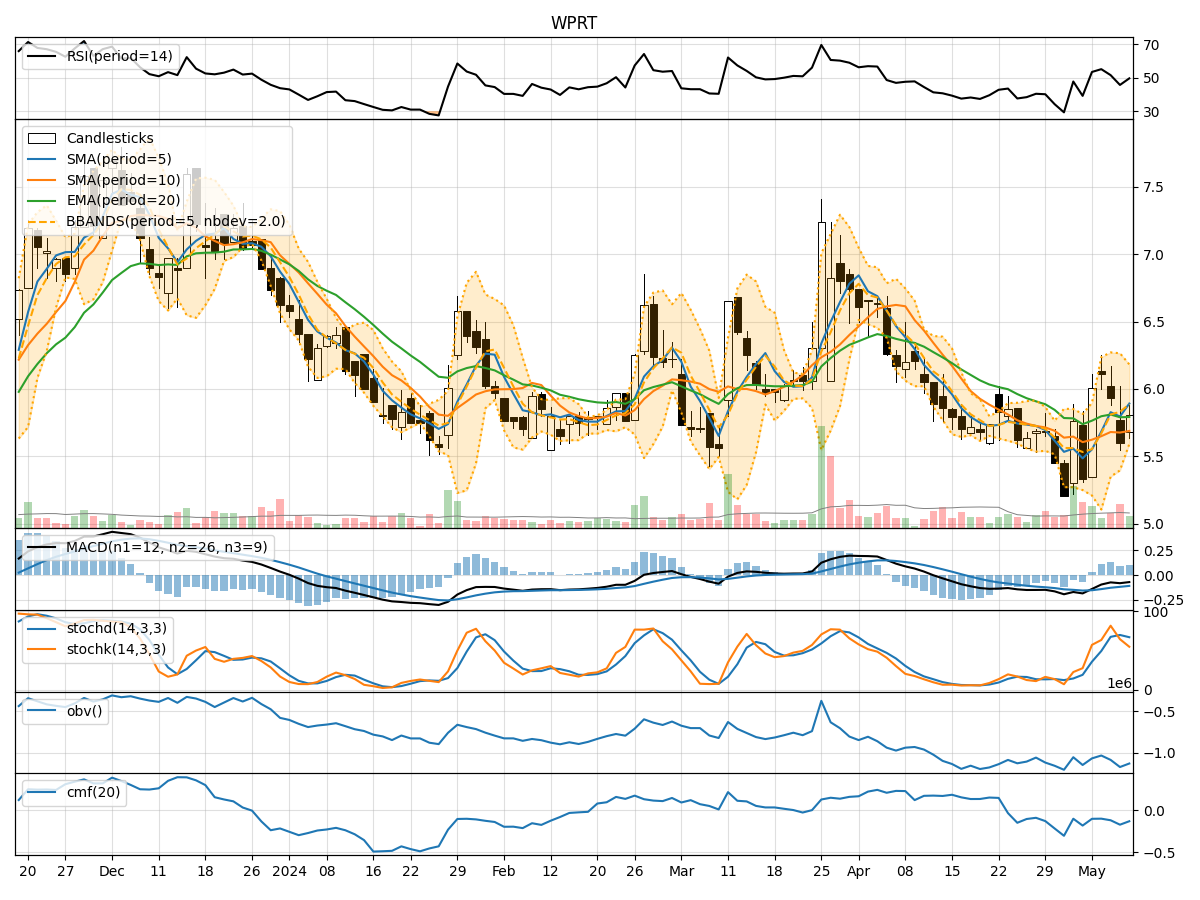
Technical Analysis of WPRT 2024-05-10
Overview:
In analyzing the technical indicators for WPRT over the last 5 days, we will delve into the trend, momentum, volatility, and volume indicators to provide a comprehensive outlook on the possible stock price movement in the coming days.
Trend Indicators:
- Moving Averages (MA): The 5-day Moving Average (MA) has been trending above the Simple Moving Average (SMA) and Exponential Moving Average (EMA) over the past 5 days, indicating a short-term bullish trend.
- MACD: The Moving Average Convergence Divergence (MACD) has shown negative values but with a slight positive divergence, suggesting a potential reversal in the bearish momentum.
Momentum Indicators:
- RSI: The Relative Strength Index (RSI) has been fluctuating around the neutral zone, indicating indecision in the market sentiment.
- Stochastic Oscillator: The Stochastic Oscillator has been moving within the overbought and oversold levels, reflecting a mixed momentum in the stock price.
Volatility Indicators:
- Bollinger Bands (BB): The Bollinger Bands have shown narrowing bands, indicating decreasing volatility in the stock price.
- Bollinger %B (BBP): The Bollinger %B has been fluctuating around the midline, suggesting a lack of clear direction in price movement.
Volume Indicators:
- On-Balance Volume (OBV): The OBV has been in a downtrend, indicating selling pressure in the stock.
- Chaikin Money Flow (CMF): The CMF has been negative, signaling a lack of buying interest in the stock.
Key Observations and Opinions:
- Trend: The short-term trend is slightly bullish based on the moving averages, but the MACD indicates a potential reversal in the bearish momentum.
- Momentum: The momentum indicators show mixed signals with no clear direction in market sentiment.
- Volatility: Volatility has been decreasing, suggesting a possible period of consolidation or sideways movement.
- Volume: The volume indicators reflect selling pressure and a lack of buying interest in the stock.
Conclusion:
Based on the analysis of the technical indicators, the stock price of WPRT is likely to experience sideways movement in the coming days. The lack of clear direction in momentum, coupled with decreasing volatility and negative volume indicators, indicates a period of consolidation. Traders and investors should exercise caution and wait for clearer signals before making any significant trading decisions.